-
... the entire area of interest. In any case, the error of estimating stratum size was small in this case.
3 KB (512 words) - 11:59, 26 October 2013
-
Line sampling uses one-dimensional lines as [[plot design|observation units]], just as we may use for many purposes fixed area
...ndard procedure when determining probabilities: we must try and define the size of the total population of needles and then identify that part of the popul
16 KB (2,744 words) - 14:08, 26 September 2023
-
...robability that element ''i'' is eventually (or included) in the sample of size ''n''. The [[Horvitz-Thompson estimator]] bases on the inclusion probabilit
... probability proportional to a meaningful variable. Imagine e.g. different plot sizes for different tree dimensions. If bigger trees are observed in larger
3 KB (437 words) - 12:34, 26 October 2013
-
..., there is no point in sampling. We, obviously, need to find an ancillary size variable of which we know that the target variable is as highly correlated
...gure 2. The parametric variances, with probabilities proportional to strip-plot area, for the estimated total and the estimated mean, respectively, are as
5 KB (697 words) - 12:00, 26 October 2013
-
... as bias or systematic error and can not be compensated by a higher sample size. You can likewise imagine an biased estimator (formula) that is not appropr
...e" bias of an estimate. We have to trust that the applied sampling design, plot design and estimators allow unbiased estimates (unbiasedness is therefore a
3 KB (446 words) - 13:15, 19 September 2011
-
...ity. Importance sampling is applicable to continuous populations where the size attribute is a function from which a probability density function is derive
...selection probabilities proportional to an [[ancillary variable|ancillary size variable]]. With a continuous population we must devise a continuous functi
8 KB (1,235 words) - 12:24, 26 October 2013
-
...right|thumb|300px|'''Figure 1''' Illustration of inclusion proportional to size (basal area) in Bitterlich sampling (Kleinn 2007<ref name="kleinn2007">Klei
...times also referred to point sampling, horizontal point sampling, variable plot sampling, angle count technique, prism cruising, angle gauge sampling, and
22 KB (3,634 words) - 07:57, 12 December 2022
-
...ain unordered set of elements (e.g. a number of trees included by a sample plot) is selected as sample.
... measurements (normally this is not only one tree, but e.g. all trees on a plot). Nevertheless we need to know the inclusion probability of each tree to de
5 KB (755 words) - 12:08, 26 October 2013
-
[[File:2.8.4-fig39.png|right|thumb|400px|'''Figure 2''' Residual plot of residual volume (<math>dm^3</math> as Y-axis and ''dbh'' (cm) as X
...to adjust to changing ''dbh''-height relationships as they occur in medium size<br>forest inventories such as [[forest enterprise inventories]] or [[forest
11 KB (1,863 words) - 11:48, 27 October 2013
-
...a defined distance (radius) from the sample point, which constitutes the plot center (Kleinn 2007<ref name="kleinn2007">Kleinn, C. 2007. Lecture Notes fo
...s showing 3 circular plots having different sizes, radii, but sharing same plot center (Kleinn 2007<ref name="kleinn2007">Kleinn, C. 2007. Lecture Notes
14 KB (2,242 words) - 08:31, 12 March 2021
-
...ver bias). A systematic error cannot be compensated by increasing [[sample size]].
...qual selection probabilities|unequal probability sampling]] approach (or [[plot design]]). Trees are included in a sample, if they appear bigger that a def
17 KB (2,464 words) - 07:47, 28 October 2013
-
...ts]] in which a certain inclusion distance (e.g. the radius of a circular plot up to which trees are included in a sample) is defined, here the number of
...eferred to as plotless methods because there is no need to lay out a fixed plot area.
11 KB (1,790 words) - 10:03, 28 October 2013
-
...<ref name="McRoberts 2003">McRoberts, R.E., 2003. Compensating for missing plot observations in forest inventory estimation. Can.J.For.Res. 33, 1990-1997</
...e [[:category:plot design|plots]] with missing observations:''' the sample size [[Accuracy and precision|precision]] decrease (because of smaller ''n''): o
5 KB (783 words) - 13:30, 26 October 2013
-
...|sampling]], the sampling elements that we select and observe are [[Sample plot|sample plots]]. Consequently, the [[population]] from which we sample is a
...subdivision of the forest area into sample plots of identical shape and size, here: square and hexagonal sample plots. Such a subdivision is also pos
8 KB (1,255 words) - 11:26, 14 June 2023
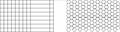 | File:4.8-fig68.png ...s: subdivision of the forest area into sample plots of identical shape and size, here: square and hexagonal sample plots. Such a subdivision is also possib
(787 × 208 (481 KB)) - 20:27, 9 March 2011 |
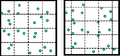 | File:4.8-fig69.png ...is obviously identical in both cases; but this is not the case for the per-plot parametric mean and variance.
(470 × 219 (302 KB)) - 20:32, 9 March 2011 |
-
...raditions and conventions and not much is thought about the choice of the plot type.
...ons were exactly known by their grid coordinates, simulation of different plot design could be carried out. There, 4969 trees were mapped on an area of 1
8 KB (1,231 words) - 10:41, 28 October 2013
-
...s obviously not desired but if we wish to make an extrapolation of the per-plot observation to the per hectare observation, then '''all''' related areas mu
...n the slope must be larger such that the target plot area results when the plot is horizontally projected. This is illustrated for circular fixed area plot
10 KB (1,686 words) - 08:36, 12 March 2021
-
... observation from point 1 in time (that is: the observations from the same plot). In that case, change ''c'' is also estimated from <math>c=\bar{y_2}-\bar{
... repeatedly observed, we can determine the differences (changes) for each plot – and not only for the entire population; we may, therefore, expect that
13 KB (2,144 words) - 07:06, 28 October 2013
-
Area estimation can be based on different plot designs that are discussed in what follows: points, lines and plots.
...mply counted how many points fall into forest; if, out of the total sample size ''n'' there are <math>n_f</math> forest points, then the forest cover propo
19 KB (3,034 words) - 07:42, 28 October 2013
