Double sampling examples
Example 1
Non-response is common in questionnaires and interviews but it is also present in forest inventories, e.g. some areas are inaccessible for topographic, security or political reasons. In satellite image analysis, we often encounter shadows and clouds that shade the areas underneath them and exclude these areas from analysis. Then, we may treat such areas under clouds and shadows as a stratum of its own (i.e. the stratum “non-response”). Then, one may carry out a sub-sample in this stratum in the 2nd phase using means of different sources than in the 1st phase to make an estimation of target variable Y.
Example 2
In the forest management inventory in the German Federal State of Lower Saxony, double sampling for stratification is used with aerial photographs in the first phase and field plots in the second phase. In the first phase, a dense grid of sample points is laid over aerial photographs (corresponding to ground distances of 100 m x 100 m). For each dot, the species composition (2 classes: hardwood dominated and softwood dominated) and the age class (4 classes) is determined; by that, a total of 8 strata is defined. The stratification has been defined like that, because in younger stands the precision requirements are not as high as in older stands; so that lesser samples are taken there. In the second phase a stratified sub-sample is taken from the first phase samples. At second phase these sample points, field plots are established and the target variables measured.
Example 3
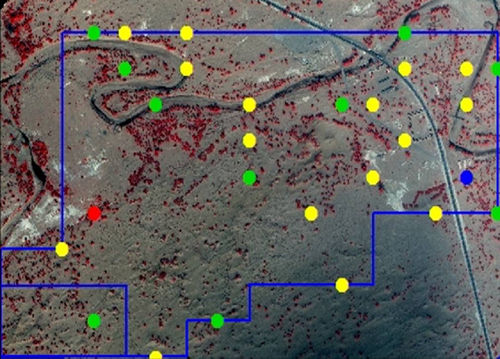
In a dry region in North-Western China, the health status of trees should be estimated. A stratification into classes of different crown cover was deemed to be an efficient sampling approach. But the tree cover was so irregular in its spatial distribution that it appeared impossible to make an a-priori stratification with reasonable efforts, see Figure 1.

In the first phase, therefore, a dense grid of sample plots was overlaid over the area of interest, and for each aerial photo sample plot the crown cover was determined. The fairly homogeneous background in the satellite image (sand) and the clear red color of the live poplar trees in the area made it possible to use a highly accurate reliable automatic algorithm to determine crown cover per plot so that square plots were analyzed that covered the entire area. In this case however, we may also say that the first phase allowed to determine exactly the size of the strata, at least if we follow the approach of defining the population as the set of all sample plots that covers, without gaps and without overlap, the entire area of interest. In any case, the error of estimating stratum size was small in this case.