-
...s known as bias or systematic error and can not be compensated by a higher sample size. You can likewise imagine an biased estimator (formula) that is not ap
...arameter to lie in this interval with a defined and known probability. The point is that the true population parameter stays known. Therefore we are not abl
3 KB (446 words) - 13:15, 19 September 2011
-
...pectively. From this set of N sections we would then select n sections as sample.
...S) is a sampling strategy that facilitates the drawing of a probabilistic sample without ''a priori'' defining the sampling frame. The inclusion probabilit
7 KB (1,099 words) - 12:30, 26 October 2013
-
...94ff </ref>). It is some times also referred to point sampling, horizontal point sampling, variable plot sampling, angle count technique, prism cruising, an
...). This is exactly what Bitterlich sampling does: from a selected [[sample point]], the neighboring trees are selected strictly proportional to their [[basa
22 KB (3,634 words) - 07:57, 12 December 2022
-
...elements (e.g. a number of trees included by a sample plot) is selected as sample.
...cal population of trees. Sampling in forestry is based on the selection of sample points and not trees. Afterwards an observation is derived by including tre
5 KB (755 words) - 12:08, 26 October 2013
-
...s the status''' of the relationship between ''dbh'' and height for a given point in time. '''It is not a growth curve'''. It can, therefore, not be used to
...all sample trees, but height only for a small sub-set, for example on each sample plot the one or two trees closest to the plot center are height measured. F
5 KB (910 words) - 13:09, 27 October 2013
-
... sample trees that are within a defined distance (radius) from the sample point, which constitutes the plot center (Kleinn 2007<ref name="kleinn2007">Klei
... Those trees are taken as sample trees in whose inclusion zones the sample point comes to lie (Kleinn 2007<ref name="kleinn2007">Kleinn, C. 2007. Lecture No
14 KB (2,242 words) - 08:31, 12 March 2021
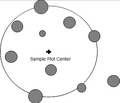 | File:4.2.2-fig46.png ...s sample trees that are within a defined distance (radius) from the sample point, which constitutes the plot center.
(361 × 311 (330 KB)) - 07:34, 3 March 2011 |
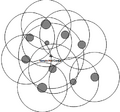 | File:4.2.2-fig47.png ... Those trees are taken as sample trees in whose inclusion zones the sample point comes to lie.
(436 × 406 (520 KB)) - 07:35, 3 March 2011 |
-
...o lie close to the [[Forest Boundary|forest boundary]] so that part of the sample plot slops over. Of course, if this is not taken into account, an error is
...ce a systematic error. [[Plot shifting]] is – from a strict statistical point of view – never permitted. Using option D in Figure 1, one needs to tak
5 KB (799 words) - 09:57, 28 October 2013
-
... (observer bias). A systematic error cannot be compensated by increasing [[sample size]].
...bability sampling]] approach (or [[plot design]]). Trees are included in a sample, if they appear bigger that a defined opening angle. Basal area can be esti
17 KB (2,464 words) - 07:47, 28 October 2013
-
..._vilcko2006">Kleinn C. and F. Vilčko 2006. Design unbiased estimation for point to tree distance sampling. Canadian Journal of Forest Research 36(6):1407-1
...e (e.g. the radius of a circular plot up to which trees are included in a sample) is defined, here the number of included trees per sampling location is fix
11 KB (1,790 words) - 10:03, 28 October 2013
-
.... Consequently, the [[population]] from which we sample is a population of sample plots.
... sample plots of identical shape and size, here: square and hexagonal sample plots. Such a subdivision is also possible for rectangles and some types
8 KB (1,255 words) - 11:26, 14 June 2023
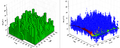 | File:4.8-fig70.png ... value of which is determined by the surrounding trees (sample plot). Each point has a value which is here indicated through the cloud of points; in additio
(816 × 328 (786 KB)) - 20:45, 9 March 2011 |
-
...xed plot area ''a<sub>k</sub>'' for an expected number of ''k'' trees per sample plot is
...math>. The variance of the estimated mean <math>\bar y</math> for a random sample of a given size n follows then from
8 KB (1,231 words) - 10:41, 28 October 2013
-
Estimations are the principal result of sampling studies. All results of a sample are estimations and must be interpreted as such; they help us to learn some
|sample based estimation
3 KB (390 words) - 08:59, 28 October 2013
-
...ean at point 2 in time and <math>\bar{y_1}</math> is the estimated mean at point 1 in time. The estimated change is a linear combination of two random vari
...ent randomizations were done, and, therefore, different [[Fixed area plots|sample plots]] selected. The change is estimated then along <math>c=\bar{y_2}-\bar
13 KB (2,144 words) - 07:06, 28 October 2013
-
...t is simply counted how many points fall into forest; if, out of the total sample size ''n'' there are <math>n_f</math> forest points, then the forest cover
which is the parametric variance. The sample based estimation of that variance has <math>(n-1)</math> degrees of freedom
19 KB (3,034 words) - 07:42, 28 October 2013
-
...mple based estimation either in remote sensing imagery or from terrestrial sample plots.
... 2005 October 3-6, Portland, Maine. Program and Abstracts: 78.</ref>) uses sample based forest edge length estimates to characterise forest edge-interior fra
11 KB (1,700 words) - 07:54, 28 October 2013
-
...n. It is more probable that there are various very good options. The major point is to avoid pitfalls and errors, and that is best done by consulting with e
...teams do exactly the same. Some more points about this extremely important point are discussed in the following;
20 KB (3,158 words) - 10:34, 27 November 2014
-
...oned glass plate that is used to make an [[Bitterlich sampling|angle count sample]]. You can estimate [[basal area]] with [[Bitterlich_sampling#Choice_of_bas
...ple]] moving around the prism – while the prism is located at the sample point.
1 KB (201 words) - 14:05, 5 November 2013

