-
Stratified sampling is actually not a new [[lectuenotes:Sampling design and plot design|sampling design]] of its own, but a procedural method to subdivide a
...chive a higher [[accuracy and precision|precision]] with the same [[sample size]]. Beside statistical issues there are further arguments for stratification
20 KB (3,198 words) - 10:07, 10 February 2024
-
...chtete Stichprobe) ist kein eigentliches [[Lectuenotes:Sampling design and plot design| Stichprobenverfahren]], sondern eine Vorgehensweise um eine [[Lectu
Bei der Herleitung des nötigen [[Lecturenotes:Sample size|Stichprobenumfang]]s, der immer durch den vogegebenen zulässigen Fehler, d
19 KB (2,774 words) - 05:00, 23 September 2011
-
...refers to the number of samples) while the [[Sampling intensity vs. sample size|sampling intensity]] is a relative value.
...ample size cannot be answered directly. But the question about what sample size is necessary to derive an estimation with a predetermined [[Accuracy and pr
4 KB (604 words) - 09:01, 28 October 2013
-
...h a sample point we define a certain area that is the [[Plot design|sample plot]] where the observation one makes on this area is assigned to the respectiv
... sampled and of which the sample frame consists are typically the [[Sample plot|sample plots]] and not single trees! In other words: one selects areas in t
4 KB (647 words) - 08:58, 28 October 2013
-
...[[Lecturenotes:population|population]] in which sampling is conducted. The size of the polygons is an expression of the [[inclusion probability|selection p
...ha that it represents once it is included in a sample under the stipulated plot design. By intersecting all buffers one can tessellate the area in single p
5 KB (834 words) - 13:00, 25 October 2015
-
...uy test questions that might be relevant in context of planning a suitable plot design in national forest inventories or for the test in forest inventory:
* Explain why a major statistical planning criterium for the choice of a [[plot design]] is to capture as much of the given variability of the target varia
2 KB (283 words) - 12:04, 26 October 2013
-
...rces available to measure <math>n=10</math> sample plots. The small sample size led to a fairly high value of the estimated [[error variance]].
... 25 m x 25 m out of each original plot. By that, you increase the [[sample size]] to the fourfold and, thus, reduce the error variance.
6 KB (963 words) - 15:18, 26 October 2013
-
|[[Image:Landsat corr fake.png|thumb|500px|'''A:'''Example plot of the brightness values of two satellite bands]]
* Select the most appropriate classifier for the available data/image size
14 KB (2,189 words) - 06:54, 11 October 2013
-
... sampling design but just a variation of [[Lectuenotes:Sampling design and plot design|response design]]: The major point in cluster sampling is that for e
...ct this observation unit of 6. In fact, most basic [[:Category:Plot design|plot designs]] as used in [[forest inventory]] can be viewed as cluster plots, w
15 KB (2,378 words) - 12:15, 29 January 2024
-
...it makes sense to speak of “plot design” as we usually select [[Sample plot|sample plots]] or more general of “observation design”.
...ted in the (forest) area of interest. Once a sample point is selected, the plot design defines how to select around that point the sample trees that are to
13 members (0 subcategories, 0 files) - 09:05, 28 October 2013
-
...ly selected. Randomization is a design component of [[Sampling design and plot design|sampling design]]. The estimators for [[simple random sampling]] are
... text=The lack of randomization cannot be compensated by increasing sample size!}}
4 KB (641 words) - 10:48, 28 October 2013
-
...pretend to be blind; and so we do on the some times long way to the sample plot! It is hypothesized that this is a waste of resources and that there must b
... that specific topic. Often, the simplest solution is to increase [[sample size]] in order to increase the probability to encounter the rare objects; howev
13 KB (2,133 words) - 12:36, 28 October 2013
-
...s]] perform differently for the same population and with the same [[sample size]].
...nterested in the y values. The <math>x</math> values are a measure for the size (area) of the strips; this will later be used in the context of other estim
5 KB (809 words) - 12:05, 26 October 2013
-
...get objects]], so that the parametric mean density in terms of objects per plot is
... therefore <math>m_i = 1</math>, <math>yi = 0</math>; they are networks of size 1.
4 KB (585 words) - 15:18, 26 October 2013
-
...plot” that is being laid out then is a large [[cluster sampling|cluster plot]] consisting of numerous sub-plots – that is, all the sample points on th
...n make an unbiased estimation of mean and variance from a random sample of size <math>n = 1</math>. For the estimation of the mean, there is no problem at
15 KB (2,359 words) - 07:35, 28 October 2013
-
...plots; here, the ratio estimator may be apllied for estimation using plot size as covariable(de Vries 1986<ref>de Vries, P.G., 1986. Sampling Theory for
...b|400px|'''Table 1''' The population of all possible systematic samples of size <math>n=10</math> drawn from the example population. There are only 3 pos
3 KB (488 words) - 12:03, 26 October 2013
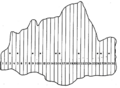 | File:5.6-fig93.png ... plots; here, the ratio estimator may be apllied for estimation using plot size as covariable (de Vries 1986)
(404 × 295 (118 KB)) - 12:14, 23 December 2010 |
-
... plots; here, the ratio estimator may be applied for estimation using plot size as co-variable (DeVries 1986<ref>de Vries, P.G., 1986. Sampling Theory for
...s known (and vice versa). Therefore, if such a co-variable is there on the plot, it would make sense to also observe it and utilize the correlation to the
15 KB (2,446 words) - 13:04, 14 April 2021
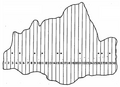 | File:5.6.1-fig93.png ... plots; here, the ratio estimator may be applied for estimation using plot size as co-variable.
(568 × 412 (687 KB)) - 21:49, 29 December 2010 |
-
...plots; here, the ratio estimator may be applied for estimation using plot size as co-variable (DeVries 1986<ref>de Vries, P.G., 1986. Sampling Theory fo
... plots]]. One approximation to estimation is to imagine a virtual [[circle plot]] through the <math>k^{th}</math> tree, that is, a circle which has a radiu
5 KB (801 words) - 16:00, 26 October 2013

