SAR change detection with SNAP
(→Visualization of amplitude bands) |
|||
| Line 12: | Line 12: | ||
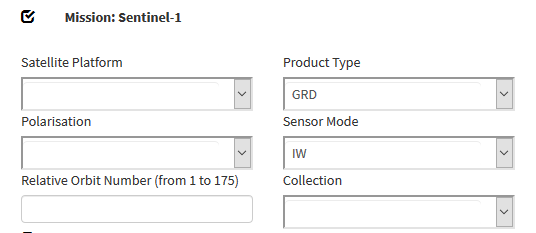
Download the images of the 06.06.2019 and 21.11.2019 (both GRD, VV/VH, IW, Descending). | Download the images of the 06.06.2019 and 21.11.2019 (both GRD, VV/VH, IW, Descending). | ||
| − | [[File: | + | [[File:esa_openhub_S1.png|600px]] |
| − | + | ||
=Visualization of amplitude bands= | =Visualization of amplitude bands= | ||
* Open SNAP Desktop. | * Open SNAP Desktop. | ||
| Line 20: | Line 19: | ||
* Right click '''Open 2 Image Window'''. | * Right click '''Open 2 Image Window'''. | ||
* {{mitem|text=Windows → Tile Horizontally}}. Both Amplitude bands are shown side by side geometrically linked to each other. The geometry ist still in sensor coordinates in Ascending mode. | * {{mitem|text=Windows → Tile Horizontally}}. Both Amplitude bands are shown side by side geometrically linked to each other. The geometry ist still in sensor coordinates in Ascending mode. | ||
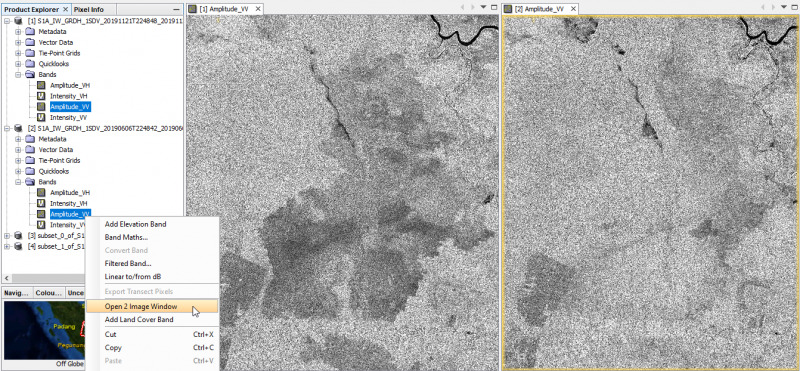
| − | [[File: | + | [[File:snap_sidebyside.png|800px]] |
=Subsetting= | =Subsetting= | ||
To reduce the data volume subset the Sentinel-1 scenes. | To reduce the data volume subset the Sentinel-1 scenes. | ||
| + | * Close horizontal tileing. | ||
* Zoom to your area of interest. | * Zoom to your area of interest. | ||
* Right click into the image and select '''Spatial Subst from View...'''. | * Right click into the image and select '''Spatial Subst from View...'''. | ||
| Line 40: | Line 40: | ||
=Radiometric and geometric calibration= | =Radiometric and geometric calibration= | ||
| − | * Select the | + | === Apply Orbit File === |
| − | * Apply Orbit File | + | * Select the subsetted product from the previous step within the '''Product Explorer''' on the left side. |
| − | * Radiometric Calibration | + | * Go to {{mitem|text=Radar → Apply Orbit File}} |
| + | * Select target product directory. | ||
| + | * Click {{button|text=Run}}. | ||
| + | |||
| + | === Radiometric Calibration === | ||
| + | * Select the product from the previous step within the '''Product Explorer''' on the left side. | ||
| + | * Go to {{mitem|text=Radar → Radiometric Calibration → Calibrate}} | ||
| + | * Select target product directory. | ||
| + | * Go to the '''Processing Parameters''' tab and check sigma0. (You could also use gamma0 processing.) | ||
| + | * Click {{button|text=Run}}. | ||
| + | |||
* Multilooking 3x3 | * Multilooking 3x3 | ||
| − | * Single Product Speckle Filter | + | |
| − | * Range-Doppler-Terrain Correction | + | === Single Product Speckle Filter === |
| + | * Select the product from the previous step within the '''Product Explorer''' on the left side. | ||
| + | * For speckle filtering, there are many different options of filter algorithms and window size. | ||
| + | * Use the Lee filter and try a window size of 3x3 and 9x9, what are the differences in your result? | ||
| + | * Go to {{mitem|text=Radar → Speckle Filtering → Single Product Speckle Filter}} | ||
| + | * Select target product directory. | ||
| + | * Go to the '''Processing Parameters''' tab and select '''Lee''' in the '''Filter''' drop down menue. | ||
| + | * Adapt the window size in X and Y direction accordingly. | ||
| + | * Click {{button|text=Run}}. | ||
| + | |||
| + | === Range-Doppler-Terrain Correction === | ||
| + | * Select the product from the previous step within the '''Product Explorer''' on the left side. | ||
| + | * Go to {{mitem|text=Radar → Geometric → Terrain Correction → Range-Doppler-Terrain Correction}} | ||
| + | * Select target product directory. | ||
| + | * Go to the '''Processing Parameters''' tab and select '''SRTM 1sec HGT (Auto Download)''' in the '''Digital Elevation Model''' drop down menue. | ||
| + | * Click {{button|text=Run}}. | ||
| + | |||
| + | |||
| + | |||
| + | * Now the image should be correctly displayed, in terms of geometry, and be smoothed. | ||
| + | |||
=Change composite= | =Change composite= | ||
Revision as of 12:37, 9 December 2019
Contents |
UNDER CONSTRUCTION
This page is currently under construction!!
Introduction
In this tutorial we will use Level-1 Ground Range Detected (GRD) Sentinel-1 data downloaded from the Copernicus Open Access Hub. The example are fire events during 2015 in a peat forest located in Eastern Jambi, Sumatra, Indonesia.
Data transfer
Download example tutorial data from Jambi or data from your personal region of interest: two Sentinel-1 scenes one pre-event acquisition date and one post-event date. Follow and adapt accordingly the instruction on Downloading Sentinel-2 images. Sentinel-1 data can have different characteristics (product type, polarization, sensor mode and ascending/descending orbit). Make sure, that you have the same characteristics for both images. Set the sensing period from 01.06.2019 to 30.11.2019. Select Product type GRD and sensor mode IW. Download the images of the 06.06.2019 and 21.11.2019 (both GRD, VV/VH, IW, Descending).
Visualization of amplitude bands
- Open SNAP Desktop.
- Go to File → Import → SAR sensors → Sentinel-1 and select the downloaded zip files.
- Unfold the product folders and Mark the Aplitude_VV bands of both products.
- Right click Open 2 Image Window.
- Windows → Tile Horizontally. Both Amplitude bands are shown side by side geometrically linked to each other. The geometry ist still in sensor coordinates in Ascending mode.
Subsetting
To reduce the data volume subset the Sentinel-1 scenes.
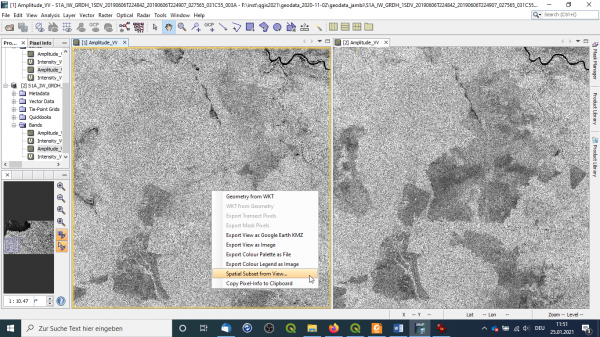
- Close horizontal tileing.
- Zoom to your area of interest.
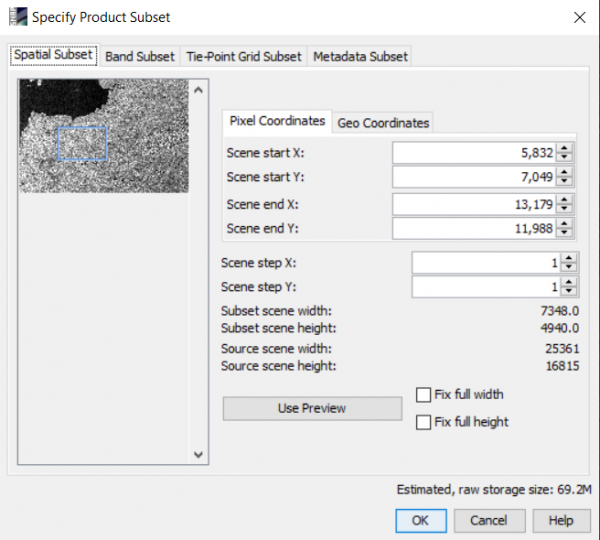
- Right click into the image and select Spatial Subst from View....
- Besides a spatial subset you could also select for single bands with this tool. Go to Bands subset and select Amplitude_VV.
- Click OK.
Please note: The image can still be in acquisition geometry, whereby the image appears mirrored.
Radiometric and geometric calibration
Apply Orbit File
- Select the subsetted product from the previous step within the Product Explorer on the left side.
- Go to Radar → Apply Orbit File
- Select target product directory.
- Click Run.
Radiometric Calibration
- Select the product from the previous step within the Product Explorer on the left side.
- Go to Radar → Radiometric Calibration → Calibrate
- Select target product directory.
- Go to the Processing Parameters tab and check sigma0. (You could also use gamma0 processing.)
- Click Run.
- Multilooking 3x3
Single Product Speckle Filter
- Select the product from the previous step within the Product Explorer on the left side.
- For speckle filtering, there are many different options of filter algorithms and window size.
- Use the Lee filter and try a window size of 3x3 and 9x9, what are the differences in your result?
- Go to Radar → Speckle Filtering → Single Product Speckle Filter
- Select target product directory.
- Go to the Processing Parameters tab and select Lee in the Filter drop down menue.
- Adapt the window size in X and Y direction accordingly.
- Click Run.
Range-Doppler-Terrain Correction
- Select the product from the previous step within the Product Explorer on the left side.
- Go to Radar → Geometric → Terrain Correction → Range-Doppler-Terrain Correction
- Select target product directory.
- Go to the Processing Parameters tab and select SRTM 1sec HGT (Auto Download) in the Digital Elevation Model drop down menue.
- Click Run.
- Now the image should be correctly displayed, in terms of geometry, and be smoothed.
Change composite
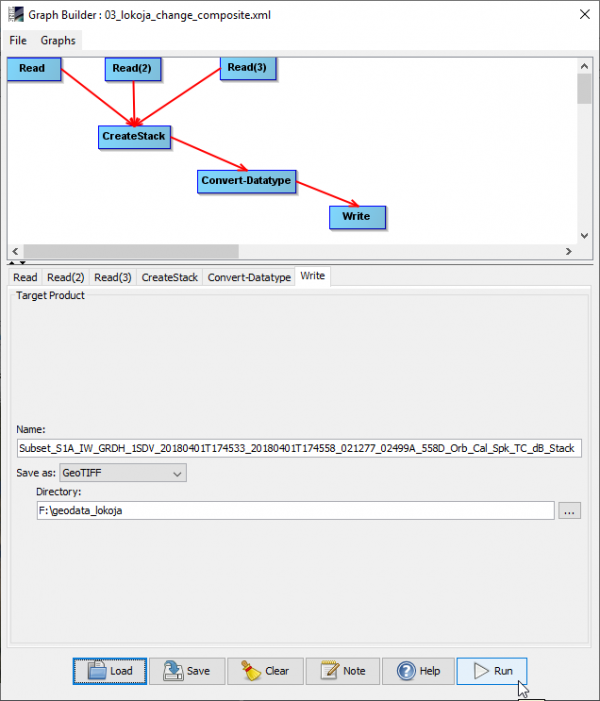
- Click Load and browse to the graph file \geodata_lokoja\03_lokoja_change_composite.xml.
- Click the Write tab. Adjust the output directory to you local path.
- Run.
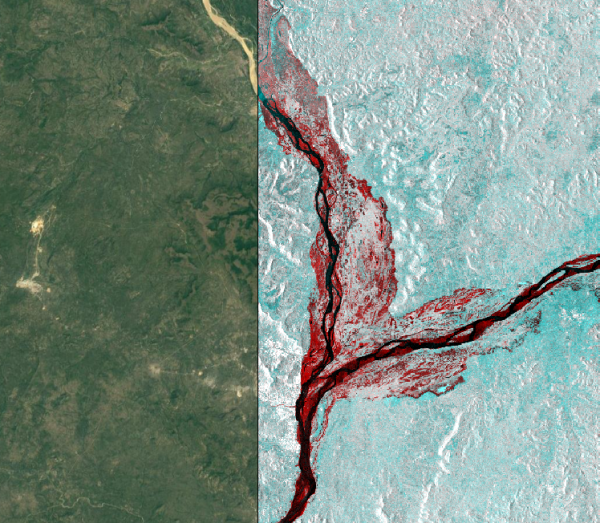
- Open QGIS.
- Data Source Manger --> Browser --> XYZ Tiles --> Google Satellite
- Load the change compoisite file with extension _Stack.tif Data Source Manger --> Raster.
- Adjust opacity of the change layer on top of Google Satellite. Layer Properties --> Transparency --> Global Transparency.
