Biomass functions and carbon estimation
The stem volume is obviously closely related to stem biomass and also to tree biomass. And the same holds for carbon content. Therefore, the basic principles of volume functions do also hold for biomass functions and for carbon functions.
Forests play a significant role in the climate system. They are important carbon sinks and sources and the assessment of their carbon budgets has received much attention in recent years (Apps and Price, 1996[1]; IPCC 2000, 2001[2]). Losses or gains of carbon may be due to deforestation or afforestation and these activities are explicitly included into Article 3.3 of the Kyoto Protocol as “accountable activities” in the national commitments to reduce net greenhouse gas emissions (UNFCCC, 1997). In contrast, “additional human-induced activities” related to forest management of existing forests in Article 3.4 of the Kyoto Protocol are less obvious with respect to their impact on the global carbon budget (Mund and Schulze, 2006[3]). All Parties to the UNFCCC must report periodically on forest carbon stock changes in their National Communications. There is also rising interest in establishing potentials for biomass from forests as a source of sustainable energy. Forest carbon emissions and sequestration are also relevant in establishment and management of forest plantations, silviculture, logging, forest management, deforestation, forest degradation, and desertification.
Constructing biomass functions

For the construction of biomass functions, a data set with observed biomass and DBH or DBH and tree height is required, for example. However, individual tree biomass is a variable that cannot be measured directly so that also the observation of individual tree biomass is usually sample based. Therefore any estimation of biomass is not affected by a measurement error alone, but carries further errors as result of modeling. Destructive sampling of the different biomass compartments of an individual tree is the standard approach, where normally the main compartments leaf/needles, branches, stem and roots are treated separately for practical reasons as well as for differences in the wood density between these different functional parts. While the whole compartment is weighted for its fresh mass in the field, only samples from each compartment are taken to lab for oven drying (at about ~105°C until weight is stable). The relation between fresh and dry mass is then used as conversion factor for the whole compartment.
The dry weights of compartments can be correlated separately or summed up to the overall aboveground biomass. In cases that also the root system was sampled, the belowground part can be incorporated to calculate the total biomass. In the context of carbon budgeting on large scale or national level, the approved methodologies of the IPCC (Intergovernmental Panel on Climate Change) for the calculation of greenhouse gas balances further propose so called Biomass Expansion Factors (BEFs) for biomass quantification. BEFs are derived as relationship between stem volume and (aboveground) biomass as:
\[BEF_i=\frac{W_i}{V_{stem}}\,\],
where:
\(W_i\,\) = dry weight (Kg) \(V\,\) = Volume (m³) \(i\,\) = total tree or compartment.
BEFs are simple “biomass functions”. Because the relative shares of different tree compartments are changing over the tree age, BEFs are not stable over a trees lifetime. New approaches therefore try to derive age-depending BEFs. Even if criticised concerning their uncertainty and inflexibility BEFs represents the only feasible pathway to carbon assessment for many developing countries, where forest inventories and reliable, recent data on growing stock volumes and increment are rudimentary or missing.
| Table 1: Series of three conversion factors whose combination allows converting stem volume to total biomass C-content (from Karjalainen and Kellomäki 1996[5]).
| ||||||||||
The expansion factor approach can also be applied for tree carbon estimation, because wood carbon content is fairly constant. By combining three conversion factors, one arrives then a conversion factor that converts stem volume (which is a standard result of forest inventories) into total biomass carbon content.
Allometric models
The standard methodology of single-tree biomass estimation is fitting parametric regression models just as with volume functions; frequently, however, the data base for biomass functions is relatively small, simply because of the high cost of obtaining biomass data. Numerous models have been derived, most of which expressed as allometric models of easily observable variables such as diameter in breast height (dbh) and tree height. Typically, these models are specific to tree species and site conditions of the particular study. Because growing conditions as well as the particular stand history are influencing the parameter estimates based on chronosequences, the derived models are restrictedly suitable for estimations on a larger scale. An early mathematical description of scaling relations in organisms was presented by Huxley (1924[6], 1932[7]).

Until today, the allometric equation \(agb=aD^b\) is the most commonly used regression model in empirical biomass studies, where \(agb\) stands for aboveground biomass, \(a\) for the integration factor and \(b\) for the scaling factor (Pretzsch, 2001[8]). The scaling factor \(b\) describes the proportion between two relative growth rates where \(dM/M=b*dD/D\). Allometry in this sense is defined as study of the relative growth of a part of an organism in relation to the growth of the whole. For regression analysis the equation is transformed to the linear logarithmic form:
\[agb=a*D^b\Rightarrow\mbox{ln }agb=\mbox{ln }a+b*\mbox{ln }D\,\]
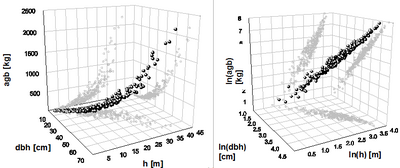
This transformation is necessary to achieve a homogeneous distribution of variances and allows the application of a simple linear regression. As back-transformation causes estimation bias, corrections are required. Figure 1 shows the relationship between dbh, tree height and aboveground biomass for a spruce dataset on a metric scale (left) and after logarithmic transformation (right).
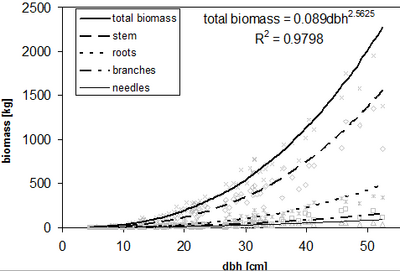
Figure 2 shows allometric functions for different tree compartments and the corresponding total biomass in a Norway spruce dataset. In most cases the coefficient of determination of biomass functions is very high (>0.9) and the consideration of tree height as additional explanatory variable is not able to enhance the model performance remarkable. This is also due to the fact that dbh and tree height are oftentimes highly correlated on the spatial limited study sites. As consequence tree height does not deliver much explanatory power.
| Table 2: Biomass regression equations for estimating biomass of tropical trees (from Brown 1996[9]). | |||||||||||||||||||||||||||||||||||||||||
\(Y\) = biomass per tree in kg, \(D\) = dbh in cm, \(BA\) = basal area in cm²
There are also tables and functions which do give predictions of the different biomass compartments like stem wood, stem bark, large branches, fine branches, leaves, roots. References
|
|||||||||||||||||||||||||||||||||||||||||