Individual Tree Detection (ITC)
From AWF-Wiki
(Difference between revisions)
(→Graphical Processing Tool Model) |
|||
| (12 intermediate revisions by one user not shown) | |||
| Line 19: | Line 19: | ||
=Watershed segmentation= | =Watershed segmentation= | ||
| − | * In the search engine of the Processing Toolbox, type {{typed|text=watershed}} and select '''Watershed | + | * In the search engine of the Processing Toolbox, type {{typed|text=watershed}} and select '''Watershed segmentation''' under Image Analysis of SAGA. |
* Select the inverted and smoothed CHM raster data file as input Grid. | * Select the inverted and smoothed CHM raster data file as input Grid. | ||
* The Output is {{button|text=Segment ID}} | * The Output is {{button|text=Segment ID}} | ||
| Line 42: | Line 42: | ||
* Toggle editing on. | * Toggle editing on. | ||
* Select features using an expression. | * Select features using an expression. | ||
| − | * Type in the expression editor: {{typed|text=" | + | * Type in the expression editor: {{typed|text="chm" <= 3}} and click {{button|text=Select}}. All points with heights below 3m are now selected. |
| − | + | ||
* Click '''Delete selected features'''. | * Click '''Delete selected features'''. | ||
* Toggle editing off. | * Toggle editing off. | ||
| + | [[File:Qgis_select_expression.png|300px]] | ||
| + | |||
| + | We produce a histogram of the tree height distribution in the forest stand. | ||
| + | * In the search engine of the Processing Toolbox, type {{typed|text=histogram}} and select '''Vector layer histogram''' under Graphics of QGIS geoalgorithms. | ||
| + | * Select the shapefile name ''seed_points_chm.shp'' as input layer. | ||
| + | * Select as Attribute the column with the extracted height values {{button|text=chm}}. | ||
| + | * Select the number of histogram bins: {{button|text=20}}. | ||
| + | * Enter name and path for a graphic output file. | ||
| + | * Click on {{button|text=Run}}. | ||
| + | [[File:Qgis_vector_histogram.png|300px]] [[File:Qgis_vector_histogram2.png|300px]] | ||
| + | |||
| + | You want to produce a statistical summary of tree heights in the stand? Use the QGIS Statistics Panel: | ||
| + | * Open {{mitem|text=View --> Statistical summary}} to open the '''Statistics Panel'''. | ||
| + | * The layer ''seed_points_chm.shp'' need to be loaded in the TOC. | ||
| + | * Choose {{button|text=seed_points_chm}} in the top combo box, then choose '''chm''' in the field selector box of the Statistics Panel. | ||
| + | * The statistical summary for tree heights of the forest stand is displayed in the Statistics Panel. | ||
| + | Report on the mean stand height. What means Q3? | ||
| + | [[File:Qgis_stat_panel.png|200px]] | ||
| − | = | + | =Graphical Processing Tool Model= |
| − | = | + | Exhausting to follow all these work steps? |
| + | You can use a prepared graphical processing toolbox model in the lidar tutorial data set: {{typed|text=ITC_detection.model}}. | ||
| + | # Open QGIS and go to the Processing Toolbox; if the Toolbox is not opened go to {{mitem|text= Processing --> Toolbox}} to activate it. Once the Toolbox is opened go to {{mitem|text= Models --> Tools --> Add model from file}} and load the previously downloaded model. | ||
| + | # The model should appear in the Models tab. Double click on it to execute. | ||
| + | # A window showing the different input and outputs should appear, just as if you were using any other geoalgorithm of the Processing Toolbox. | ||
| + | # You will just need to provide the model with the LiDAR data input file in LAZ format. | ||
| + | [[File:Qgis_graphical_model.png|500px]] | ||
[[Category:QGIS Tutorial]] | [[Category:QGIS Tutorial]] | ||
Latest revision as of 14:26, 8 January 2018
Contents |
[edit] Filter the CHM derived from LiDAR data
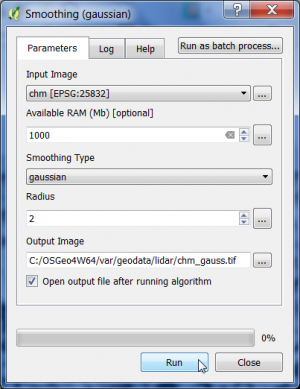
We use a Canopy Height Model (CHM) derived from LiDAR data as decribed here to detect Individual Tree Crowns (ITC). Two preprocessing steps prepare a watershed segmentation approach: (1) Gaussian filtering and (2) inversion of a CHM.
- In the search engine of the Processing Toolbox, type smooth and select Smoothing (gaussian) under Image filtering of the Orfeo Toolbox.
- Select the CHM raster data file in GeoTiff format as input layer.
- The smoothing type is gaussian.
- The circular structuring element has a radius of 2 pixels.
- Enter name and path for an output file.
- Click on Run.
[edit] Invert the CHM
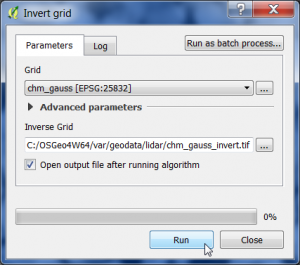
Now the smoothed CHM will be inverted.
- In the search engine of the Processing Toolbox, type invert and select Invert grid under Raster tools of SAGA.
- Select the smoothed CHM raster data file from previous step as input layer.
- Enter name and path for an output file.
- Click on Run.
[edit] Watershed segmentation
- In the search engine of the Processing Toolbox, type watershed and select Watershed segmentation under Image Analysis of SAGA.
- Select the inverted and smoothed CHM raster data file as input Grid.
- The Output is Segment ID
- Select as Method the flow accumulation of Minima
- Seed points: enter name and path for a vector point output file.
- Click on Run.
[edit] Extracting tree heights
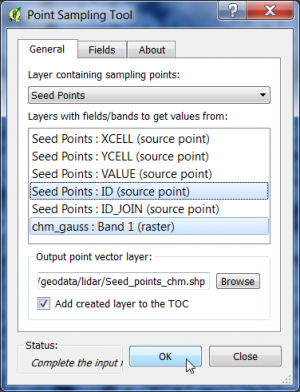
We extract normalized heights from the original CHM using the QGIS point sampling plugin.
- Click Plugins --> Manage and Install Plugins.
- Type in the search bar Point sampling tool, click on the plugin name and then on Install plugin.
- Load the single band raster file chm.tif.
- Load the vector point file Seed points.shp'.
- Make sure that both layers are ticked in the TOC.
- Open the Point Sampling Tool clicking
 .
.
- Specify the output of the resulting vector file marking column with CTRL + left click.
- Enter an output shapefile name seed_points_chm.shp and path by clicking Browse.
- Confirm with OK. The new layer is added to the Layer Panel .
- Right click on the layer name in the TOC and open the Attribute table of the new vector layer.
- Toggle editing on.
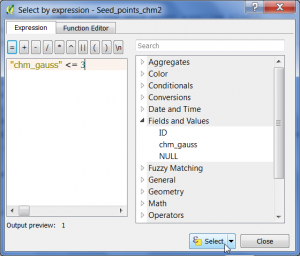
- Select features using an expression.
- Type in the expression editor: "chm" <= 3 and click Select. All points with heights below 3m are now selected.
- Click Delete selected features.
- Toggle editing off.
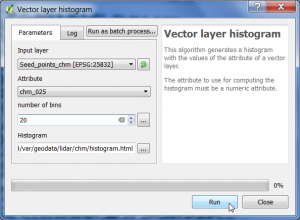
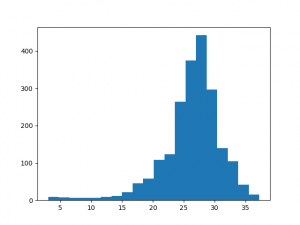
We produce a histogram of the tree height distribution in the forest stand.
- In the search engine of the Processing Toolbox, type histogram and select Vector layer histogram under Graphics of QGIS geoalgorithms.
- Select the shapefile name seed_points_chm.shp as input layer.
- Select as Attribute the column with the extracted height values chm.
- Select the number of histogram bins: 20.
- Enter name and path for a graphic output file.
- Click on Run.
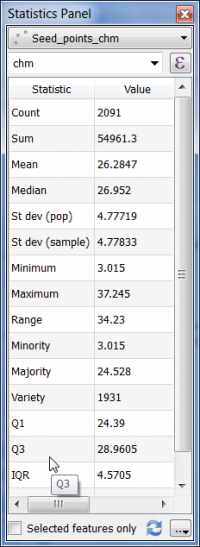
You want to produce a statistical summary of tree heights in the stand? Use the QGIS Statistics Panel:
- Open View --> Statistical summary to open the Statistics Panel.
- The layer seed_points_chm.shp need to be loaded in the TOC.
- Choose seed_points_chm in the top combo box, then choose chm in the field selector box of the Statistics Panel.
- The statistical summary for tree heights of the forest stand is displayed in the Statistics Panel.
Report on the mean stand height. What means Q3?
[edit] Graphical Processing Tool Model
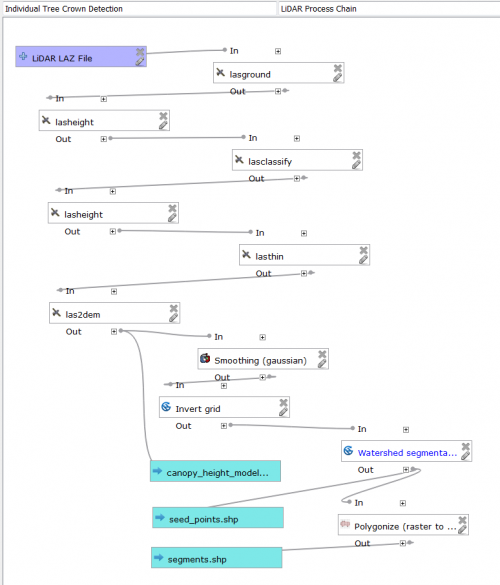
Exhausting to follow all these work steps? You can use a prepared graphical processing toolbox model in the lidar tutorial data set: ITC_detection.model.
- Open QGIS and go to the Processing Toolbox; if the Toolbox is not opened go to Processing --> Toolbox to activate it. Once the Toolbox is opened go to Models --> Tools --> Add model from file and load the previously downloaded model.
- The model should appear in the Models tab. Double click on it to execute.
- A window showing the different input and outputs should appear, just as if you were using any other geoalgorithm of the Processing Toolbox.
- You will just need to provide the model with the LiDAR data input file in LAZ format.
