Canopy Height Model based on Airborne Laserscanning using LAStools
Download of LAStools
LASTools is software for efficient processing of LiDAR data (Laser scanning data) programmed by rapidlasso GmbH. There are two parts of LAStools: one part is Open Source (LGPL 2.1), the other part is Closed Source and requires licensing for most commercial or government uses. The closed source software may be used without charge for non-profit personal, non-military educational, or non-profit humanitarian purposes. Note, that the output of the unlicensed version can be slightly distorted after certain point limits (1 million points) are exceeded. Download the recent version as LAStools.zip file. Extract the zip file to a folder without space (e.g. C:\LAStools).
Configure Tools for LiDAR data in QGIS Processing Toolbox
Start QGIS.
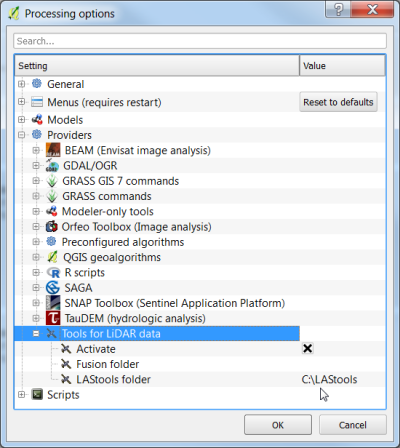
Open Processing --> Options --> Providers --> Tools for LiDAR data.
Check the Activate button and fill in the path to your local LAStools folder as shown below.
Point cloud visualization: lasview
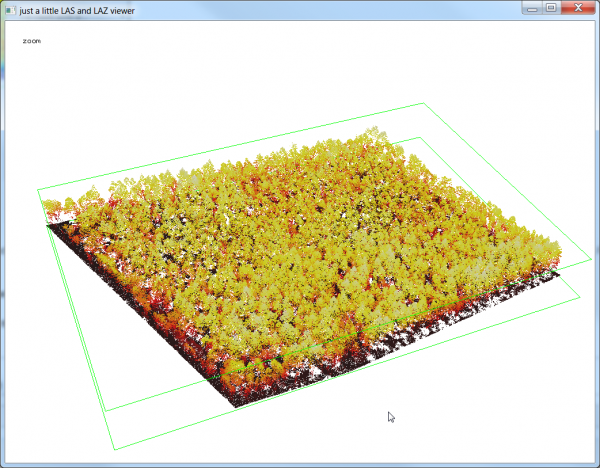
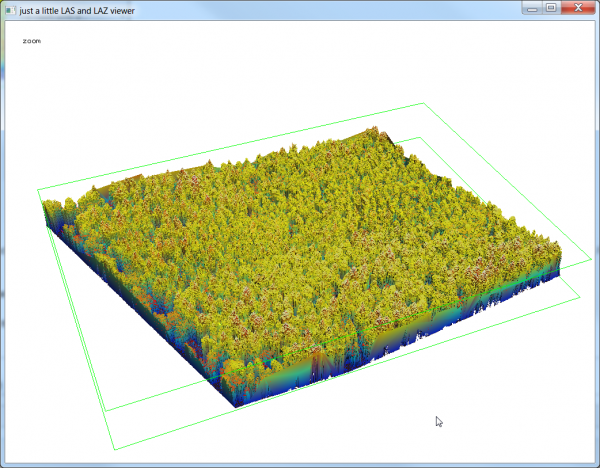
lasview is an OpenGL-based viewer for LiDAR in LAS/LAZ/ASCII format that can also edit or delete points as well as compute/display a TIN computed from (a selection of) points.
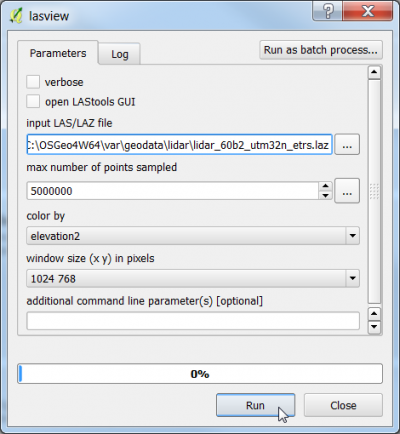
- In the search engine of the Processing Toolbox, type lasview and select lasview under LAStools of the Tools for LiDAR data.
- Select a LiDAR data file in LAZ format as the input layer.
- Select color by elevation2 from the drop down list.
- Click on Run to start the viewer.
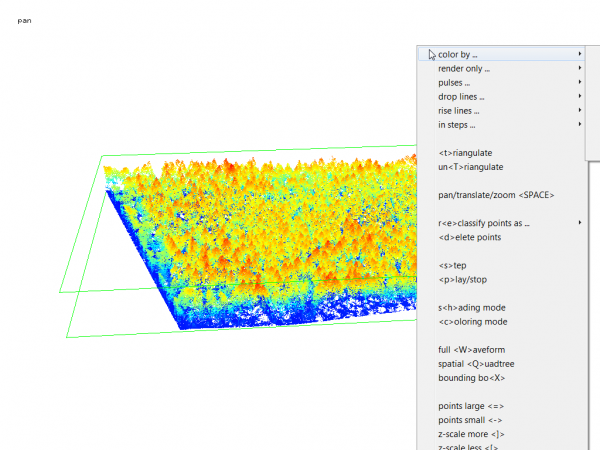
- The viever will open in PAN mode. Left click and hold moving the cursor to rotate the point cloud. Press the space bar to switch to TRANSLATE or ZOOM mode and change the perspective interactively. Open the context menu with a right click to see other functions of lasview as seen below.
- Type <c> to try other color maps.
- Type <t> to create a TIN.
- Type <h> to try different shadings of the TIN.
- Type <T> to return back to the point cloud view.
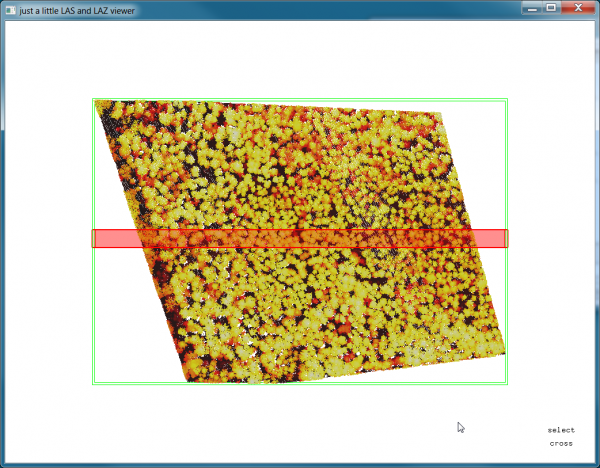
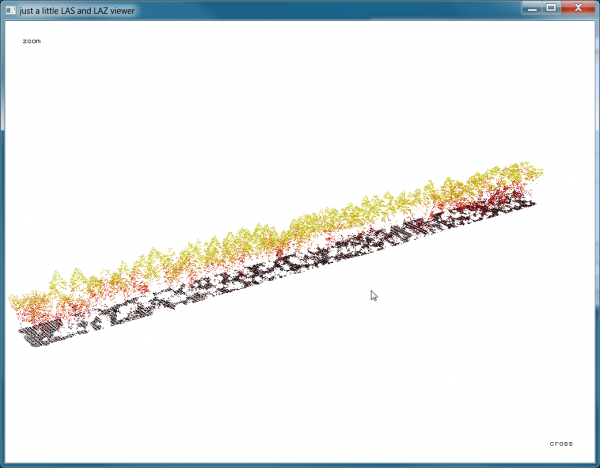
- For quality checking and detail views you can press <x> and select a cross section or smaller area of interest. Move it around with the arrow key. Holding down <SHIFT> or <ALT> is taking larger or smaller steps.
- Press <x> again and you see only the selected area.
- Jump back between cross section view and the full extend with <x>.
- Type <X> to switch the green bounding box off or on.
- You can also edit the classification of the points as well as delete them. For more details see the README file in the C:\LAStools\bin folder or open the context menu with a right mouse click on the viewer.
Point cloud metadata: lasinfo
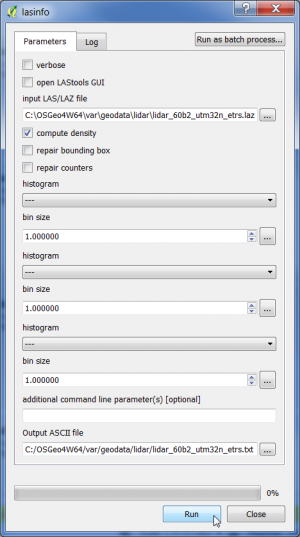
lasinfo reports the contents of the file header and a short summary of the points such as point density and spacing.
- In the search engine of the Processing Toolbox, type lasinfo and select lasinfo under LAStools of the Tools for LiDAR data.
- Select a LiDAR data file in LAZ format as the input layer.
- Check the Compute density button.
- Enter name and path for the output text file.
- Click on Run.
- Open the output file with an text editor an report the most important LiDAR data characteristics:
- Which Coordinate Reference System is defined?
- What is the point density?
- What is the point spacing?
Classify ground and non-ground points: lasground
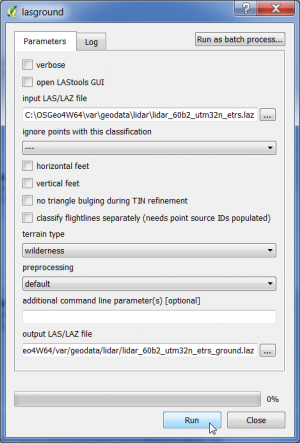
lasground is a tool for bare-earth extraction: it classifies LIDAR points into ground points (class = 2) and non-ground points (class = 1).
- In the search engine of the Processing Toolbox, type lasground and select lasground under LAStools of the Tools for LiDAR data.
- Select a LiDAR data file in LAZ format as the input layer.
- Select as terrain type wilderness.
- Select default preprocessing.
- Enter name and path for the classified output file.
- Click on Run.
Remove low and high outliers: lasheight
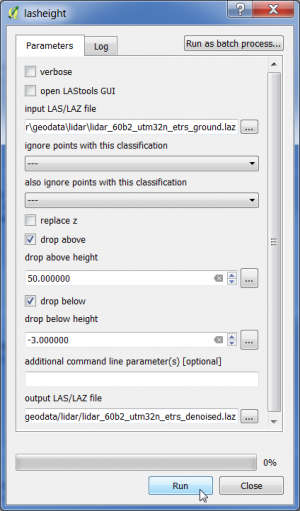
lasheight removes low and high outliers that are often just noise (e.g. clouds or birds). By default lasheight uses the points classified as ground to construct a TIN and then calculates the height of all other points in respect to this ground surface TIN. with '-drop_above 50 -drop_below -3' all points that are 50 meters above the ground or 3 meters below the ground are removed from the output LAZ file.
- In the search engine of the Processing Toolbox, type lasheight and select lasheight under LAStools of the Tools for LiDAR data.
- Select the LiDAR data file in LAZ format with the classifed ground points as the input layer.
- Check drop above and as drop-above height type 50.
- Check drop below and As drop-below height type -3.
- Enter name and path for the denoised output file.
- Click on Run.
Identify tree layer in the denoised file: lasclassify
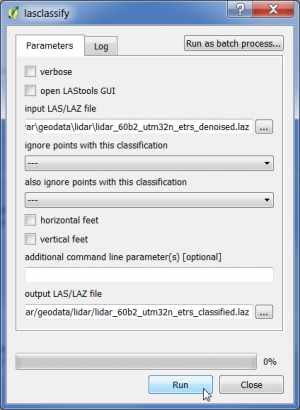
lasclassify identifies buildings and trees (high vegetation, class = 5) in a denoised file.
- In the search engine of the Processing Toolbox, type lasclassify and select lasclassify under LAStools of the Tools for LiDAR data.
- Select the denoised LiDAR data file in LAZ format as the input layer.
- Enter name and path for the classified output file.
- Click on Run.
Create a normalized point cloud: lasheight
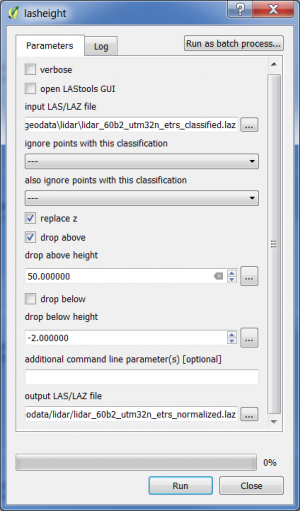
lasheight creates a point cloud with normalized heights with the option '-replace_z'.
- In the search engine of the Processing Toolbox, type lasheight and select lasheight under LAStools of the Tools for LiDAR data.
- Select the LiDAR data file in LAZ format with the classifed ground points as input layer.
- Check replace z.
- Check drop above and as drop-above height type 50.
- Enter name and path for the normalized output file.
- Click on Run.
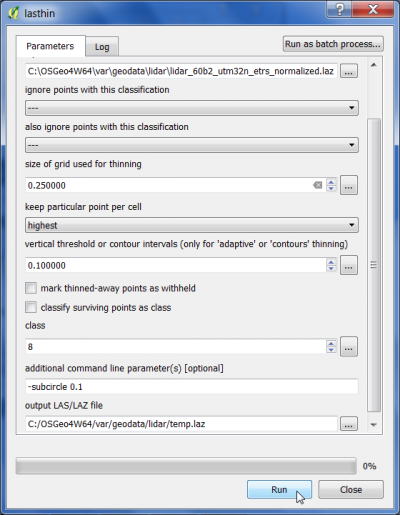
Create a CHM directly from height-normalized points: lasthin and las2dem
A Canopy Height Model (CHM) can be computed as a difference between DSM and DTM. At first A DTM is created from the ground returns and a DSM from the first returns. The two rasters are subtracted from one another. A different approach computes the CHM directly from height-normalized LiDAR points in a two step approach: (1) keep only one highest return per grid cell with lasthin (2) interpolate all these highest returns with las2dem.
- In the search engine of the Processing Toolbox, type lasthin and select lasthin under LAStools of the Tools for LiDAR data.
- Select the LiDAR data file in LAZ format with the height-normalized ground points as input layer.
- The size of grid is 0.25 which is about rhe mean point spacing of the input LiDAR file.
- We keep the highest points per cell.
- As additional option we define a circular footprint with a radius of 10cm typing -subcircle 0.1.
- Enter name and path for a temporary output file.
- Click on Run.
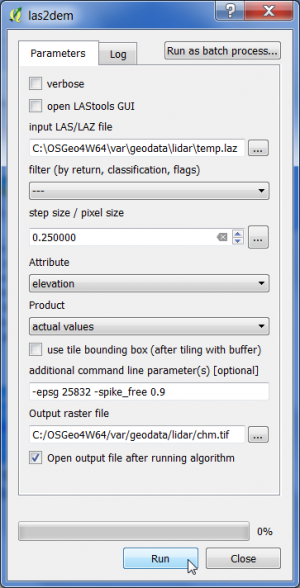
- In the search engine of the Processing Toolbox, type las2dem and select las2dem under LAStools of the Tools for LiDAR data.
- Select the temporary LiDAR data file as input layer.
- The step or pixel size is 0.25m.
- Select the Attribute elevation and the Product actual values.
- The additional command line parameters-epsg 25832 defines the output Coordinate reference system (ETRS/UTM32) and -spike_free 0.9 defines an additional filtering.
- Enter name and path for an output raster file in format GeoTiff.
Create a DSM with abolute heights: las2dem
A digital surface model (DSM) in raster format can be used as basis for a precise orthorectification ("True Orthos") of aerial images.
- In the search engine of the Processing Toolbox, type las2dem and select las2dem under LAStools of the Tools for LiDAR data.
- Select the classified LiDAR data file (see above) as input layer.
- The step or pixel size is 0.25m.
- Select the Attribute elevation and the Product actual values.
- The additional command line parameter -epsg 25832 defines the output Coordinate reference system (ETRS/UTM32) and takes only the first_only returns.
- Enter name and path for an output raster file in format GeoTiff.
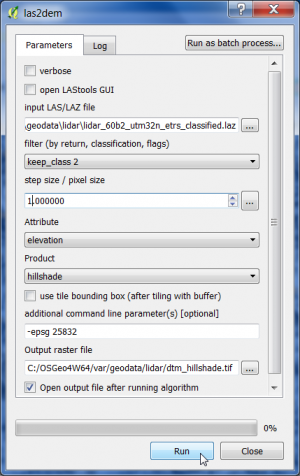
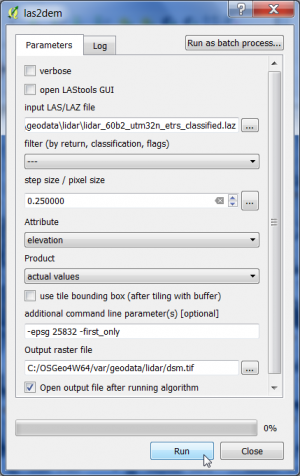 If the Product type is changed to hillshade and a shaded relief is produced as shown below.
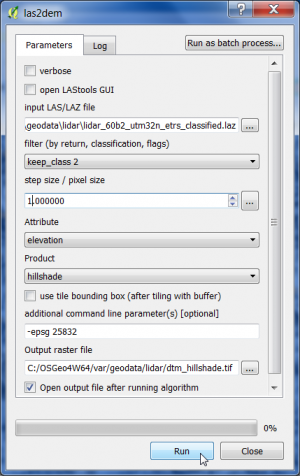
Create a DTM with abolute heights: las2dem
A Digital Terrain Model can be produced in raster format.
- Use again. las2dem under LAStools.
- Select the classified LiDAR data file (see above) as input layer.
- The step or pixel size is 1.0m.
- Select the Attribute elevation and the Product actual values.
- The additional command line parameter -epsg 25832 defines the output Coordinate reference system (ETRS/UTM32) and only the first_only returns.
- Enter name and path for an output raster file in format GeoTiff.
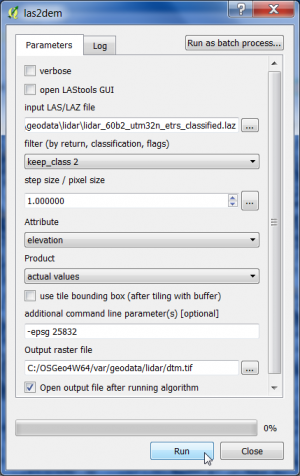 Change the Product type to hillshade and a shaded relief is produced as shown below.
