Using Qgis2threejs
From AWF-Wiki
(Difference between revisions)
(Created page with "[https://plugins.qgis.org/plugins/Qgis2threejs/ Qgis2threejs] plugin exports terrain data, map canvas image and vector data to your web browser. You can view exported 3D objec...") |
|||
| (One intermediate revision by one user not shown) | |||
| Line 1: | Line 1: | ||
| − | [ | + | The Qgis2threejs plugin visualizes raster and vector data in 3D on web browsers. Files are generated which can be published in the web in a very simple procedure. |
| + | * Prepare a [http://wiki.awf.forst.uni-goettingen.de/wiki/index.php/Digital_Elevation_Model_(DEM)_Processing#Shaded_relief_layer_styling shaded relief layer]. | ||
| + | * Select {{mitem|text=Plugin --> Manage and install plugins}} and install the {{typed|text=Qgis2threejs}} plugin. | ||
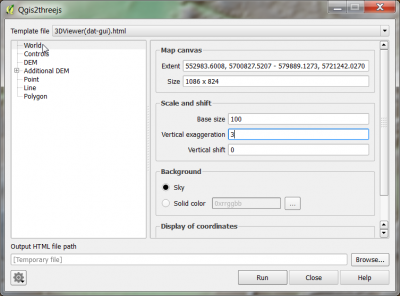
| + | * {{mitem|text=Web --> Qgis2threejs --> Qgis2threejs}}. Click on {{button|text=World}} and increase the ''Vertical exaggeration'' to {{typed|text=3}}. | ||
| + | [[File:qgis_3js_settings2.png|400px]] | ||
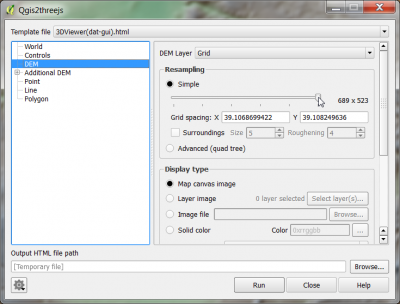
| − | = | + | * Click {{button|text=DEM}}. Specify the source of the digital elevation model. Increase the spatial resolution: drag the slider in '''Resampling''' to the right. |
| − | + | [[File:qgis_3js_settings.png|400px]] | |
| − | + | ||
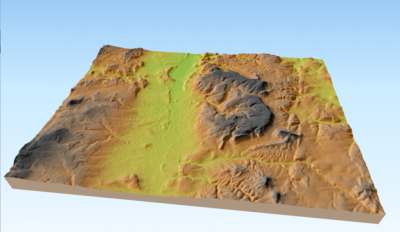
| + | * Click {{button|text=Run}}. Your default web browser will be opened and an interactive 3D view wit the extent of the current map canvas will be displayed. | ||
| + | [[File:qgis_3js_browser.png|400px]] | ||
| + | |||
| + | * In the settings window click {{button|text=Controls}} to find out the interactive mouse functions. | ||
| + | * Here is an example link to a [http://www.gwdg.de/~hfuchs/dem/3js_view.html 3D view] published in the web. | ||
[[category: 3D Visualization]] | [[category: 3D Visualization]] | ||
Latest revision as of 10:47, 16 April 2018
The Qgis2threejs plugin visualizes raster and vector data in 3D on web browsers. Files are generated which can be published in the web in a very simple procedure.
- Prepare a shaded relief layer.
- Select Plugin --> Manage and install plugins and install the Qgis2threejs plugin.
- Web --> Qgis2threejs --> Qgis2threejs. Click on World and increase the Vertical exaggeration to 3.
- Click DEM. Specify the source of the digital elevation model. Increase the spatial resolution: drag the slider in Resampling to the right.
- Click Run. Your default web browser will be opened and an interactive 3D view wit the extent of the current map canvas will be displayed.
- In the settings window click Controls to find out the interactive mouse functions.
- Here is an example link to a 3D view published in the web.


