File list
This special page shows all uploaded files. When filtered by user, only files where that user uploaded the most recent version of the file are shown.
| Date | Thumbnail | Size | User | Description | Versions | |
|---|---|---|---|---|---|---|
| 09:19, 16 October 2011 | Add vector.png (file) | 18 KB | Lburgr | (Screenshot of QGIS toolbars with marked „add vector“ icon) | 1 | |
| 16:28, 20 October 2010 | Addpoints.png (file) |  | 932 B | Lburgr | (Screenshot of QGIS setting control points icon) | 1 |
| 16:14, 1 November 2010 | Addvaluesmanually.png (file) |  | 825 B | Lburgr | (Screenshot of the QGIS “add attributes tool” icon for attribute tables.) | 1 |
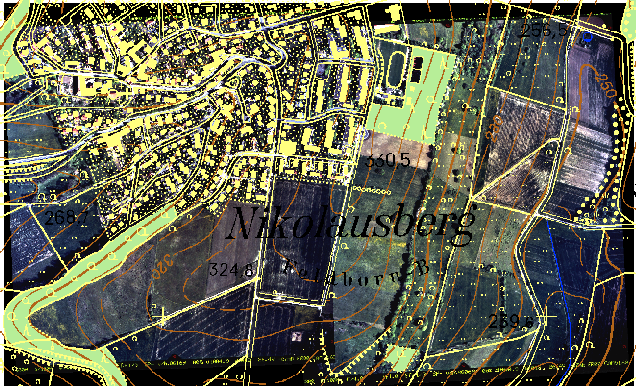
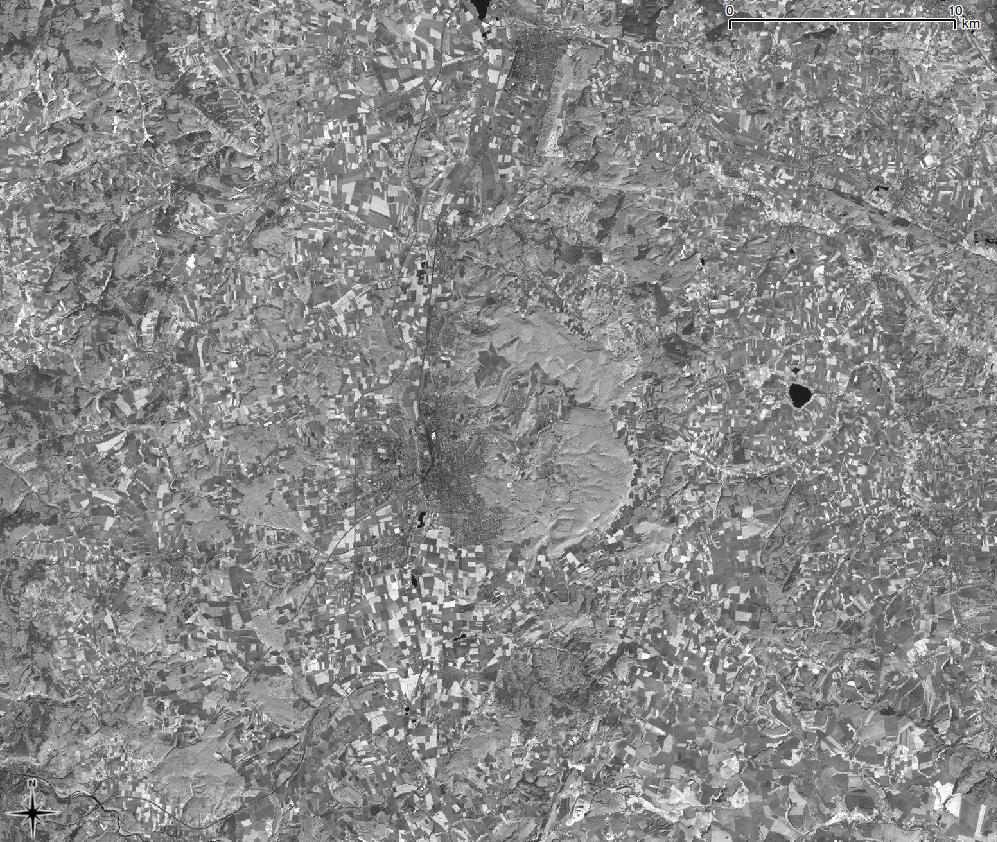
| 17:41, 20 October 2010 | Aerial mosaic.png (file) |  | 467 KB | Lburgr | (Aerial photo of the village Nikolausberg in Goettingen, Germany) | 1 |
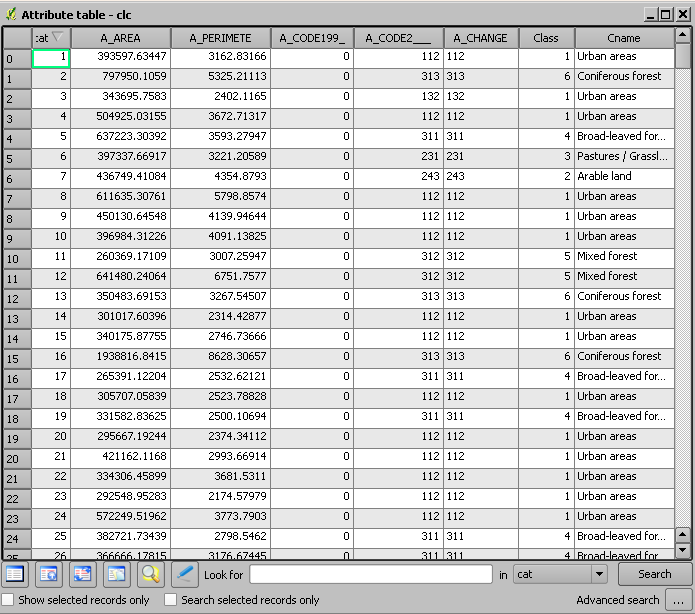
| 19:36, 19 October 2010 | Attributetable.png (file) |  | 30 KB | Lburgr | (Screenshot of QGIS attribute table) | 1 |
| 16:17, 13 February 2011 | Change NDVI 92 05 comp.jpg (file) |  | 266 KB | Lburgr | (A multitemporal color composite created in GRASS and exported to tif-format. Inadequate symbology.) | 1 |
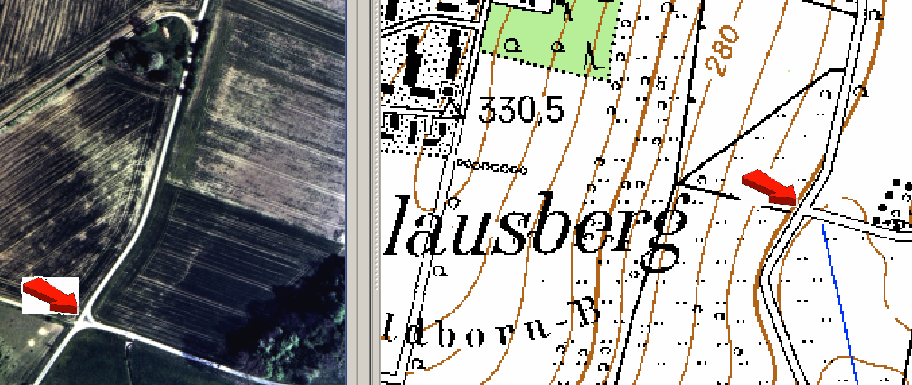
| 17:16, 20 October 2010 | Choosepoints.png (file) |  | 244 KB | Lburgr | (Screenshot of aerial photograph and map in QGIS) | 1 |
| 09:34, 18 February 2011 | Colormap example.jpg (file) |  | 220 KB | Lburgr | (Example of a rastermap displayed with the colormap option in QGIS) | 1 |
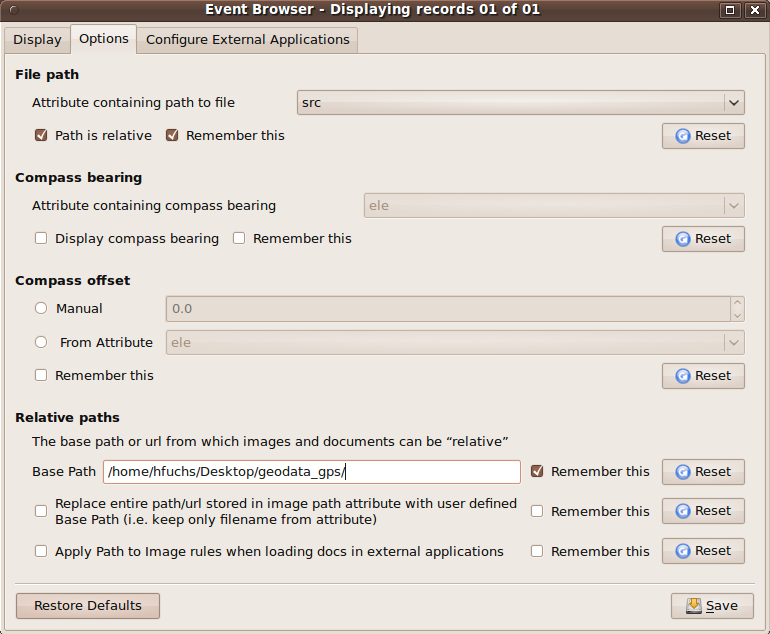
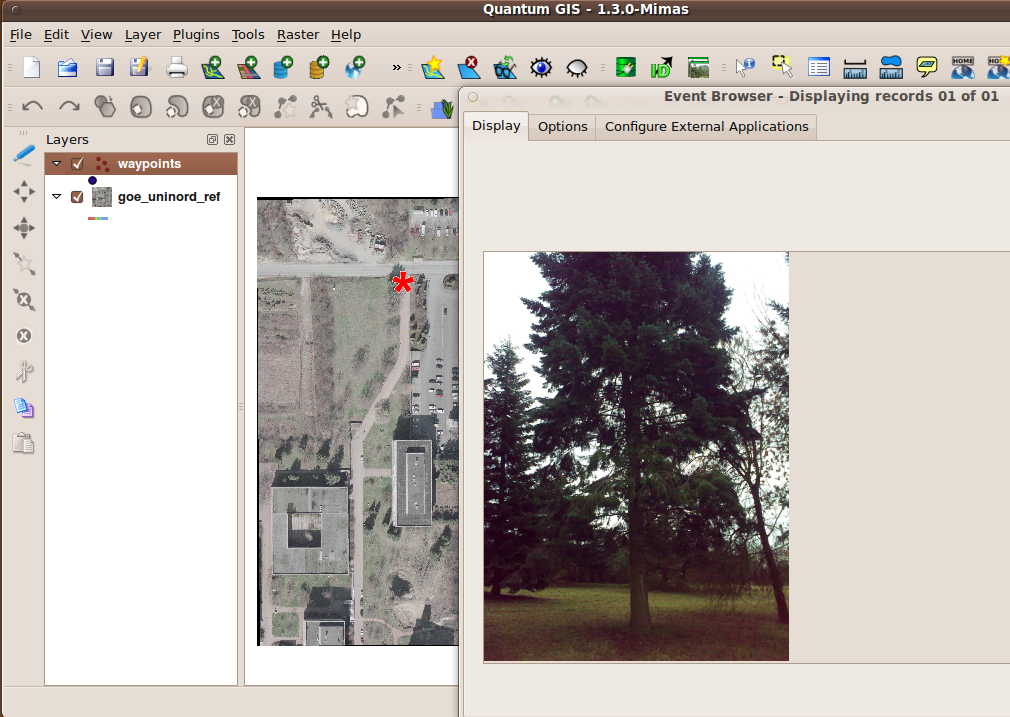
| 12:31, 26 October 2010 | Configure evis.png (file) |  | 86 KB | Lburgr | (Screenshot of EVIS Event Browser in QGIS.) | 1 |
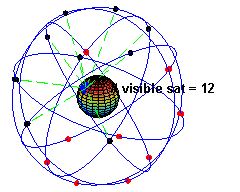
| 16:49, 14 April 2011 | ConstellationGPS.gif (file) |  | 485 KB | Lburgr | (A simulation of the original design of the GPS space segment, with 24 GPS satellites (4 satellites in each of 6 orbits), showing the evolution of the number of visible satellites from a fixed point (45ºN) on earth (considering "visibility" as having dire) | 1 |
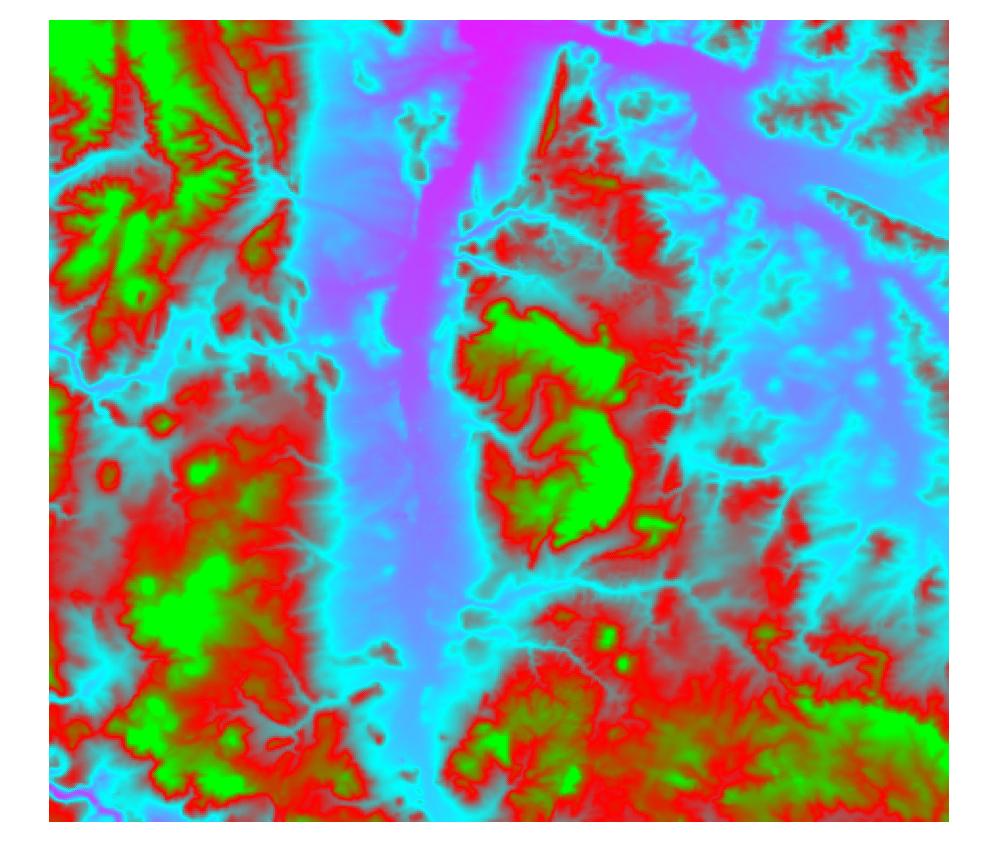
| 14:33, 17 February 2011 | Dem freak.jpg (file) |  | 93 KB | Lburgr | (A digital elevation model displayed with the QGIS “freak out” option.) | 1 |
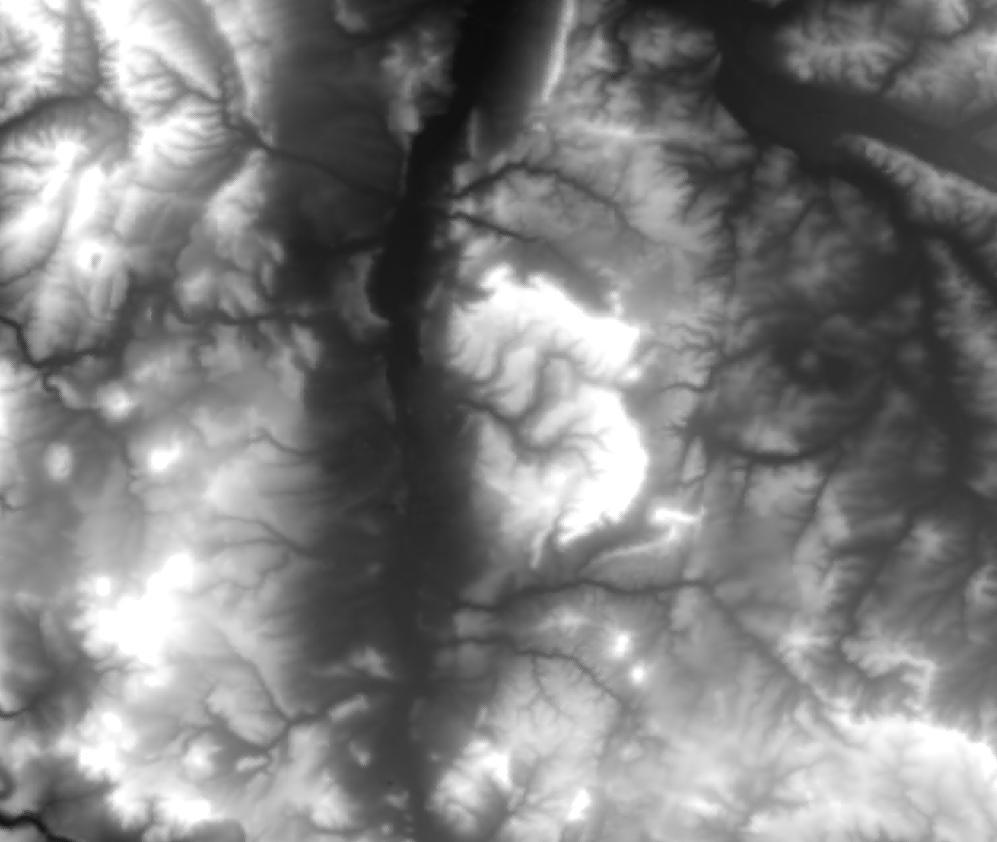
| 16:20, 26 January 2011 | Dem grey.jpg (file) |  | 60 KB | Lburgr | (A digital elevation model displayed in greyscale.) | 1 |
| 16:21, 26 January 2011 | Dem pseudo.jpg (file) |  | 97 KB | Lburgr | (A digital elevation model displayed in pseudocolor.) | 1 |
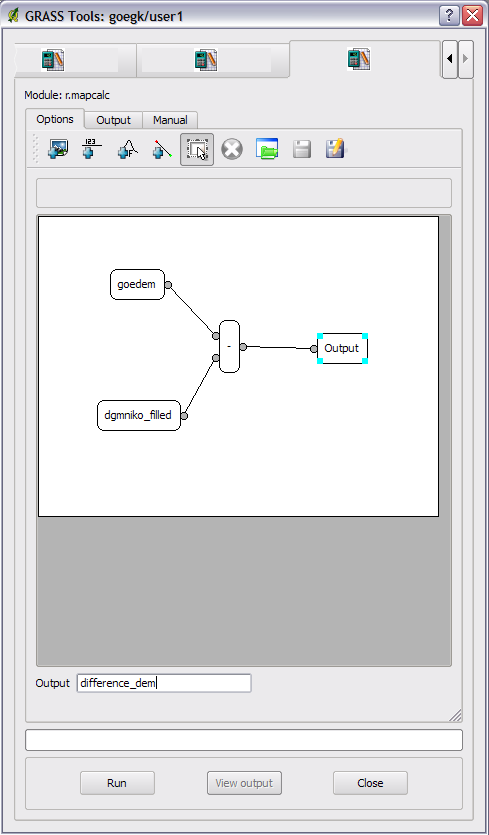
| 18:07, 25 October 2010 | Difference dem.png (file) |  | 25 KB | Lburgr | (Screenshot of GRASS r.mapcalc window in QGIS.) | 1 |
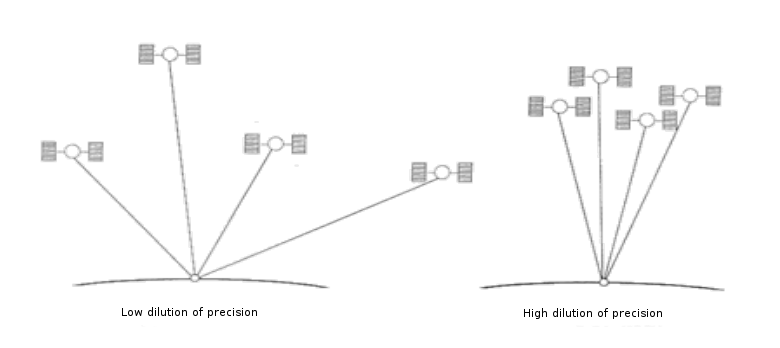
| 16:47, 15 April 2011 | Dilution of precision.png (file) |  | 40 KB | Lburgr | (An image of the dilution of precision (DOP) depending on the position of satellites on the horizon during GPS positioning.) | 1 |
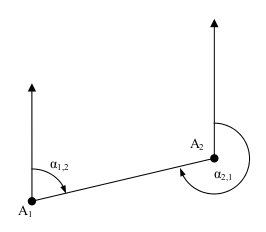
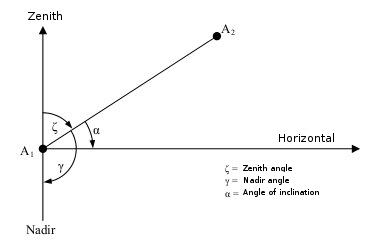
| 17:33, 15 May 2011 | Dir angle.jpg (file) |  | 4 KB | Lburgr | (A Sketch displaying the principle of the azimuth/direction angle) | 1 |
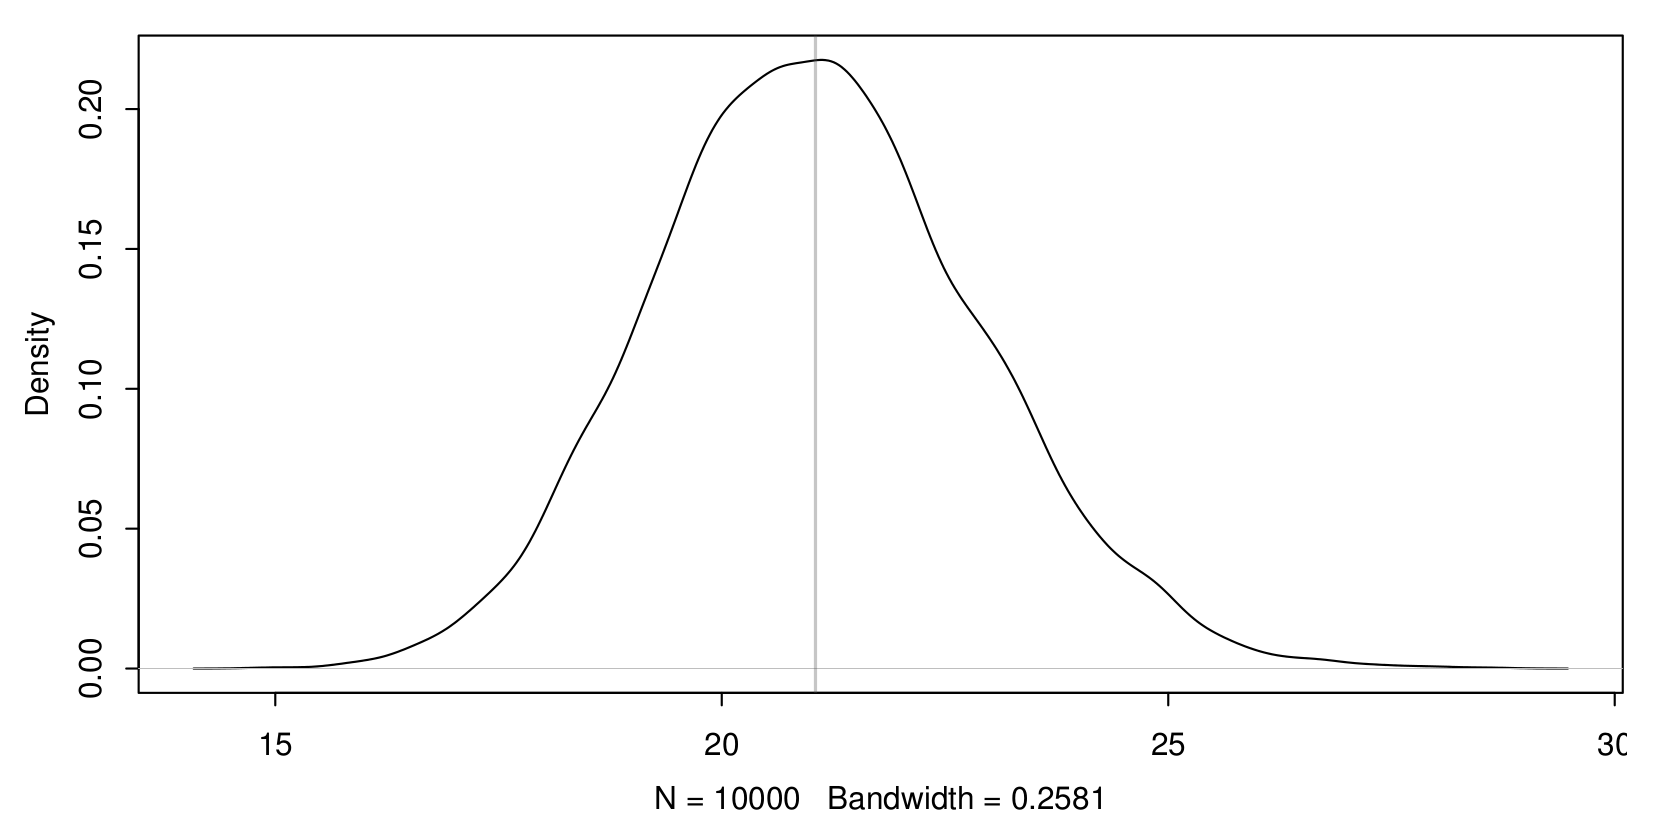
| 10:14, 23 June 2014 | Ecdf means n50.png (file) |  | 59 KB | Lburgr | (Empirical distribution function of means, generated in R. See the resource assessment exercises for details and code. ) | 1 |
| 17:15, 1 November 2010 | Edit toolbar.png (file) | 14 KB | Lburgr | (Screenshot of QGIS editing toolbar.) | 1 | |
| 10:53, 26 October 2010 | Edit toolbar 1.png (file) |  | 4 KB | Lburgr | (Screenshot of QGIS “Start editing” button.) | 1 |
| 17:19, 15 May 2011 | Elev angle.jpg (file) |  | 12 KB | Lburgr | (Changed labels to english) | 2 |
| 13:51, 26 January 2011 | Etm40 grey.jpg (file) |  | 214 KB | Lburgr | (Fourth band of a LANDSAT image symbolized in grey scale.) | 1 |
| 13:52, 26 January 2011 | Etm40 grey stdev.jpg (file) |  | 267 KB | Lburgr | (Fourth band of a LANDSAT image symbolized in greyscale; based on a standard deviaton of 2.5 with stretch to MinMax in QGIS.) | 1 |
| 12:33, 26 October 2010 | Event picture.png (file) |  | 524 KB | Lburgr | (Screenshot of EVIS event window in QGIS.) | 1 |
| 12:29, 26 October 2010 | Evis event button.png (file) |  | 2 KB | Lburgr | (Screenshot of QGIS EVIS event plugin button.) | 1 |
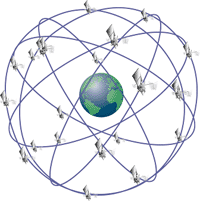
| 17:04, 14 April 2011 | GPS-24 satellite.png (file) |  | 10 KB | Lburgr | (Configuration of GPS satellites. This picture belongs to the public domain. For information on the original upload see the [http://commons.wikimedia.org/wiki/File:GPS-24_satellite.png?uselang=de]) | 1 |
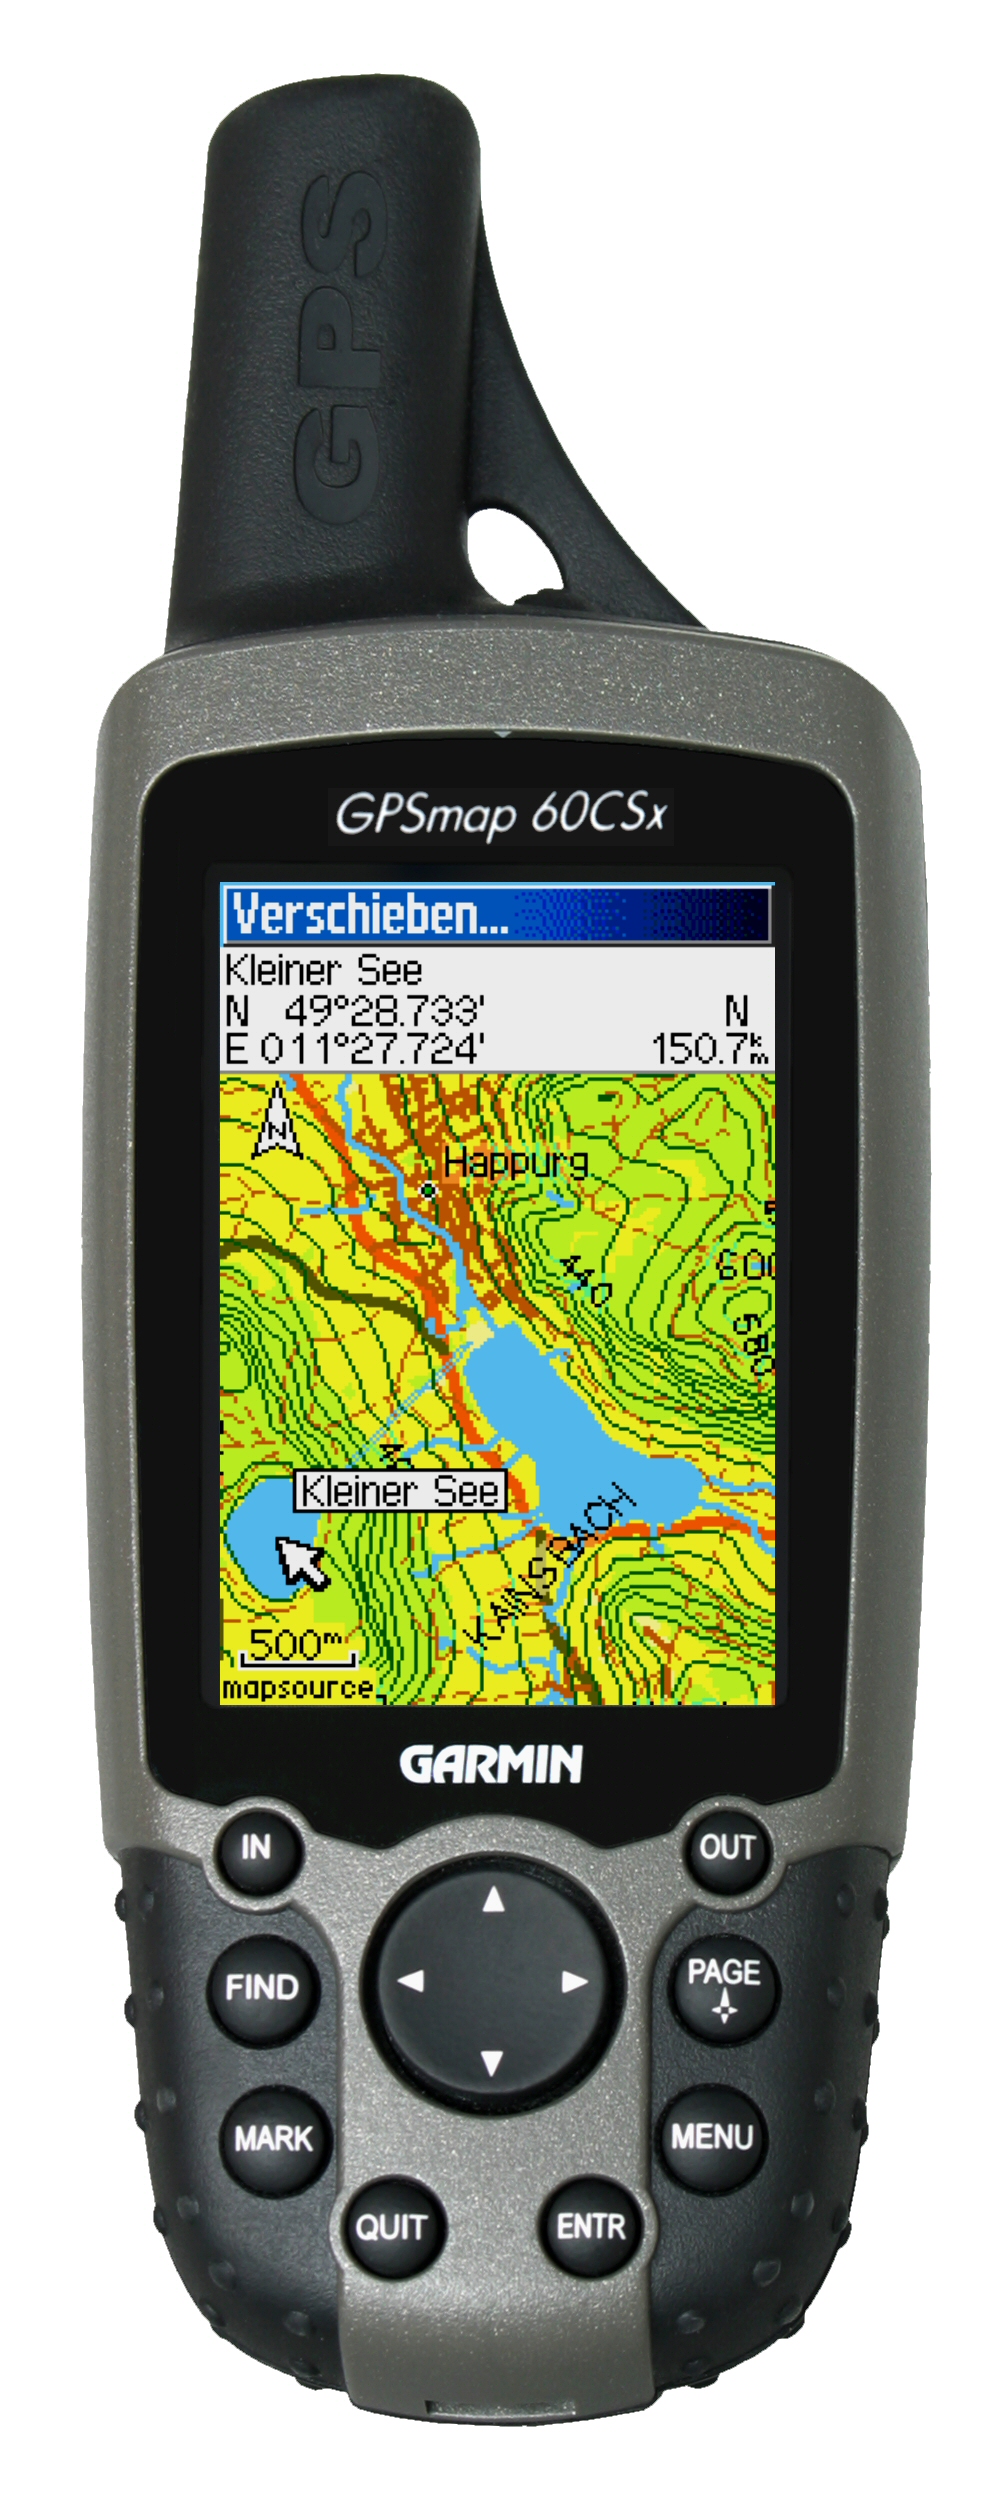
| 16:11, 23 April 2011 | GPSMAP60CSx-2-Topo.jpg (file) |  | 1.02 MB | Lburgr | (An image of the Garmin GPSmap 60CSx device. The file was taken from garmin.com, is owned by garmin and is licensed under the Creative Commons lincense. It is allowed to copy, publish and modify the file according to the [[wi) | 1 |
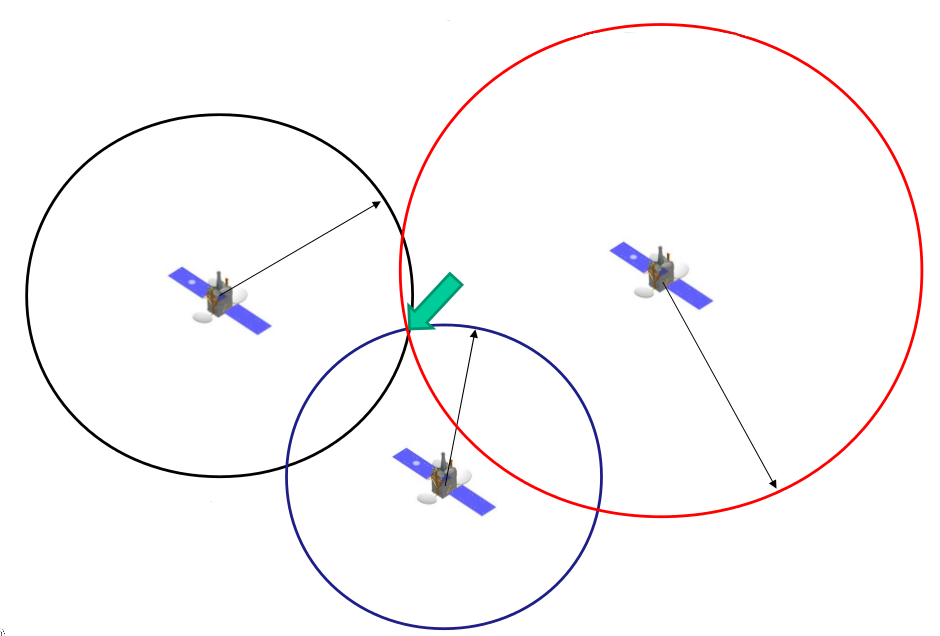
| 18:27, 14 April 2011 | GPS principle.png (file) |  | 85 KB | Lburgr | (The principle of GPS positionig with three satellites.) | 1 |
| 15:46, 23 April 2011 | Garmin add waypoint.png (file) |  | 56 KB | Lburgr | (An image of the Garmin GPS receivers main menu display with text explaining its components.) | 1 |
| 15:44, 23 April 2011 | Garmin main.png (file) |  | 6 KB | Lburgr | (An image of the Garmin GPS receivers main menu display.) | 1 |
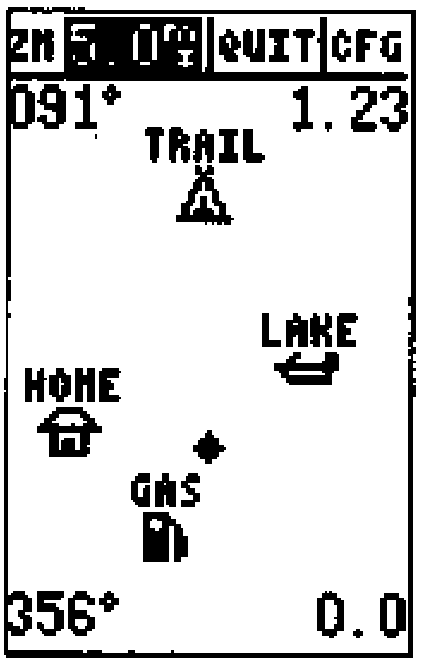
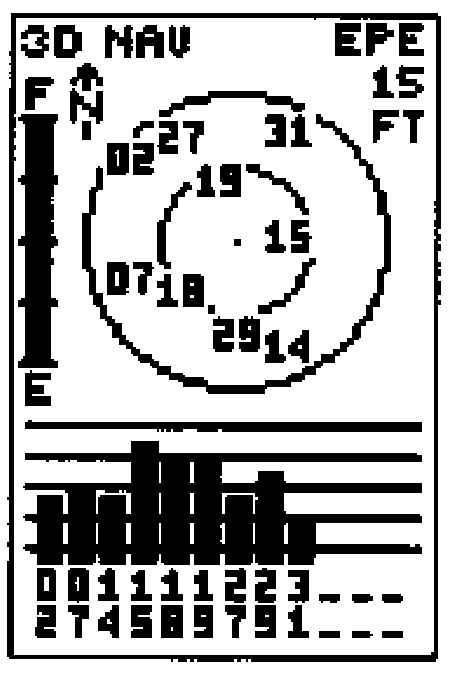
| 12:40, 23 April 2011 | Garmin map.png (file) |  | 5 KB | Lburgr | (An image of the Garmin GPS receivers map display) | 1 |
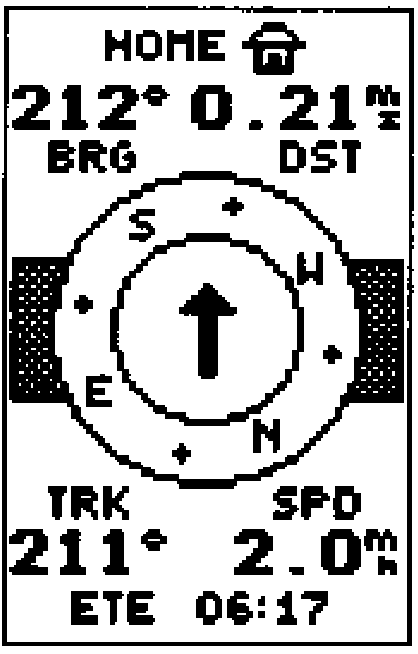
| 15:36, 23 April 2011 | Garmin navigation.png (file) |  | 6 KB | Lburgr | (A screenshot of the Garmin GPS receivers navigation display) | 1 |
| 12:15, 23 April 2011 | Garmin position.png (file) |  | 6 KB | Lburgr | (An image of the Garmin GPS receivers position display) | 1 |
| 11:51, 23 April 2011 | Garmin satellite.png (file) |  | 6 KB | Lburgr | (An image of the Garmin GPS receivers satellite display) | 1 |
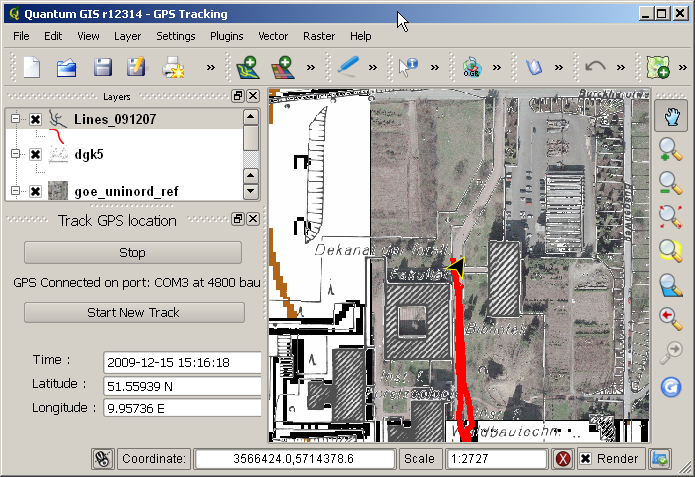
| 11:45, 26 October 2010 | Gps track1.png (file) |  | 309 KB | Lburgr | (Screenshot of QGIS GPS-Tracking window) | 1 |
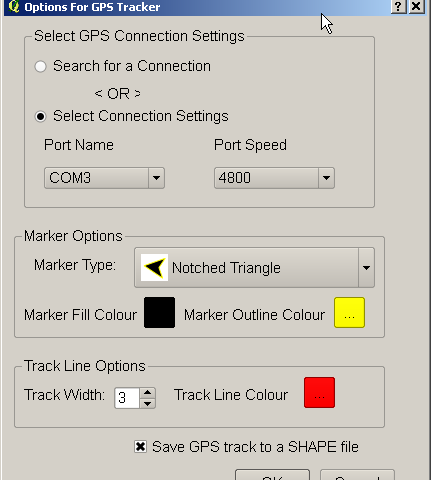
| 11:48, 26 October 2010 | Gps track2.png (file) |  | 13 KB | Lburgr | (Screenshot of QGIS “Options for GPS-Tracker” window.) | 1 |
| 15:57, 20 October 2010 | Grass shell.png (file) |  | 1 KB | Lburgr | (Screenshot of GRASS shell icon) | 1 |
| 11:45, 20 October 2010 | Grass toolbar.png (file) | 9 KB | Lburgr | (Screenshot of QGIS GRASS-Toolbar) | 1 | |
| 16:07, 20 October 2010 | Grass tools.png (file) |  | 2 KB | Lburgr | (Screenshot of QGIS GRASS tools icon.) | 1 |
| 15:36, 20 February 2011 | Grassdata example.jpg (file) |  | 70 KB | Lburgr | (Screenshot of a file-manager window displaying a GRASS database directory with locations and mapsets) | 1 |
| 15:36, 3 September 2013 | Hierarchical Clustering.png (file) |  | 52 KB | Lburgr | (An example R plot to illustrate hierarchical clustering, containing fictional data points and a dendrogram. R Code: ## Some fictional satellite brightness values: rm(list=ls()) set.seed(23) # just change the seed to see different outcomes! da...) | 1 |
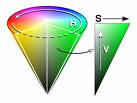
| 13:51, 26 October 2010 | Hiscone.jpg (file) |  | 3 KB | Lburgr | (Graphic of HSI color model) | 1 |
| 12:05, 3 August 2013 | Iterative Clustering.png (file) |  | 113 KB | Lburgr | (Added main title.) | 2 |
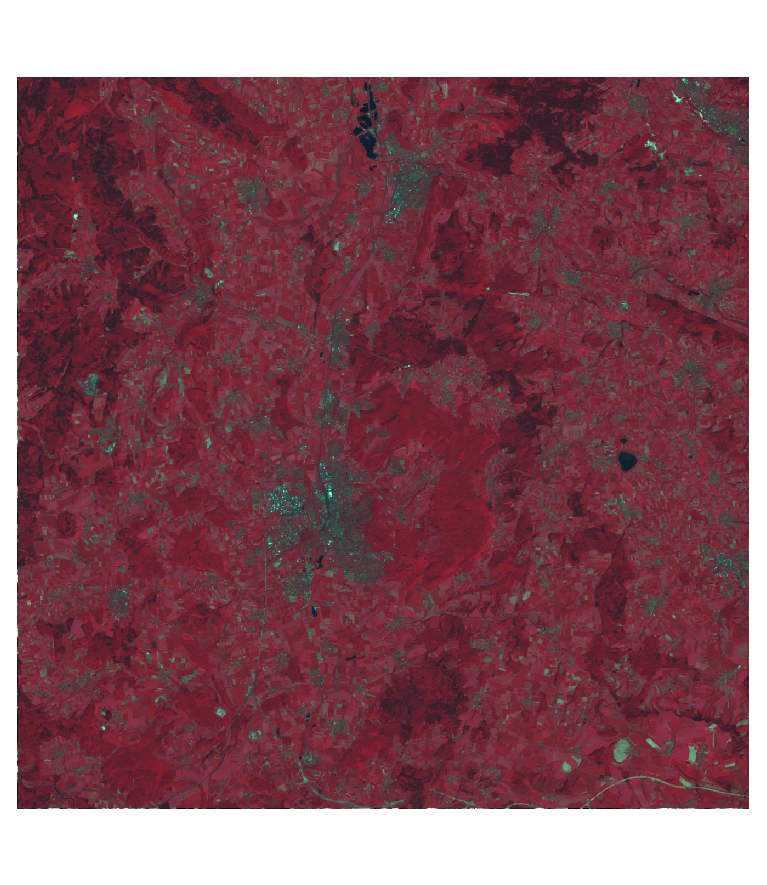
| 18:24, 8 December 2013 | Landsat Goettingen 432.png (file) |  | 968 KB | Lburgr | (False color composite of LANDSAT bands 4,3, and 2 from the Göttingen area.) | 1 |
| 16:14, 25 June 2013 | Landsat corr.png (file) |  | 78 KB | Lburgr | (Correlation of LANDSAT bands 4 and 5, based on the input data provided for the exercises of the lecture "Remote sensing image processing with open source GIS". A link to the data will be provided as soon as it is downloadable. Code: library(rgdal) ...) | 1 |
| 12:01, 21 June 2013 | Landsat corr fake.png (file) |  | 2.45 MB | Lburgr | (A plot of fictional correlation between brightness values of two satellite bands. Generated in R and edited with GIMP. Code: -------------------------------------------------------------------- data <- data.frame(band.4=c(rnorm(500, mean=100, sd=20), ...) | 1 |
| 14:35, 11 September 2011 | Languagetab QGis 1.7 ger winxp.png (file) |  | 25 KB | Lburgr | (Screenshot of german QGIS 1.7 options menu with highlighted language tab in Windows XP) | 1 |
| 10:23, 18 October 2011 | Manu3.jpg (file) |  | 78 KB | Lburgr | (Newer version (QGIS 1.7) under WinXP with highlighted browser tab and "Add to canvas" icon) | 2 |
| 12:36, 16 October 2011 | Map navigation.png (file) | 27 KB | Lburgr | (Reverted to version as of 08:36, 16 October 2011 - uploaded wrong file by accident) | 4 | |
| 17:22, 20 October 2010 | Mapcanvas.png (file) |  | 11 KB | Lburgr | (Screenshot of QGIS dialog for adding control points for georeferenciation.) | 1 |
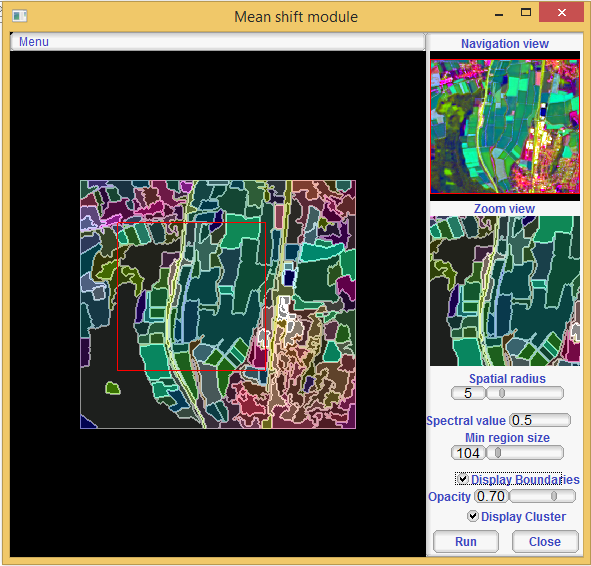
| 17:10, 18 February 2014 | Monteverdi Mean shift.png (file) |  | 982 KB | Lburgr | (Screenshot of the ''Mean shift'' module in Monteverdi with loaded satellite image.) | 1 |
First page |
Previous page |
 Next page |
Last page |