Raster histogram
From AWF-Wiki
(Difference between revisions)
| (27 intermediate revisions by one user not shown) | |||
| Line 1: | Line 1: | ||
| − | # Click the {{button|text=Add raster layer}} [[Image:QGIS_2.0_addrast.png|20px]] and select | + | == Using Layer Properties == |
| − | # After clicking {{button|text=Open}}, the raster layer appears on the QGIS canvas. | + | # Click the {{button|text=Open Data Source Manager}} [[Image:QGIS_3.0_datasource.png|30px]] and then {{button|text=Add raster layer}} [[Image:QGIS_2.0_addrast.png|20px]] and select a single or a multiband band raster file. |
| − | # Right click the layer name in the | + | # After clicking {{button|text=Open}} , the raster layer appears on the QGIS canvas. |
| − | + | # Right click the layer name in the Layers panel and select {{mitem|text=Properties --> Histogram}} | |
| − | The value range of the | + | # Click {{button|text=Compute Histogram}}. A histogram for all bands is displayed (Figure '''A'''). Left click and drag a box on the diagram to zoom in. [[File: Qgis_histogram_multiband.png|thumb|left|200px|'''Figure A:''' Line histograms of all bands]] |
| − | + | Click on {{button|text=Pref/Actions}} and deactivate ''Draw as lines''. Activate ''Show selected band'' and ''Always show min/max markers''. | |
| + | The value range of the selected band data is evenly divided into bins. The histogram shows how many pixels of the image fall into each of the bins (Figure '''B''')[[File: Qgis_histogram_singleband.png|thumb|right|200px|'''Figure B:''' Histogram of a single selected band]]. Click on [[File: Qgis_save_icon.png|20px]]. The graphics may be saved as png file. | ||
[[Category: Working with Raster Data]] | [[Category: Working with Raster Data]] | ||
Latest revision as of 13:44, 2 November 2020
[edit] Using Layer Properties
- Click the Open Data Source Manager
 and then Add raster layer
  and select a single or a multiband band raster file.
- After clicking Open , the raster layer appears on the QGIS canvas.
- Right click the layer name in the Layers panel and select Properties --> Histogram
- Click Compute Histogram. A histogram for all bands is displayed (Figure A). Left click and drag a box on the diagram to zoom in.
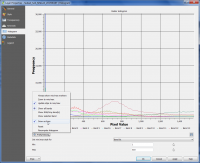 Figure A: Line histograms of all bands

Click on Pref/Actions and deactivate Draw as lines. Activate Show selected band and Always show min/max markers.
The value range of the selected band data is evenly divided into bins. The histogram shows how many pixels of the image fall into each of the bins (Figure B)