Creating a multi-band GeoTIFF
From AWF-Wiki
| sorry: |
This section is still under construction! This article was last modified on 12/8/2013. If you have comments please use the Discussion page or contribute to the article! |
- This exercise is part of the QGIS Tutorial 2013/14.
In this exercise you will learn how to create images of several bands of satellite data, and how to georeference a raster image.
Multiband layers
To create a multiband image:
- Load the different satellite band layers into QGIS. For exercise purposes, you can use the landsat-bands from the directory geodata/raster/landsat/ in the course data; the layer names start with sub, the band number is indicated by B and a one- or two-digit number, e.g. B1 or B10 for the first band and B1 or B20 for the second.
- If the processing toolbox is not visible in you QGIS window yet, select Processing --> Toolbox.
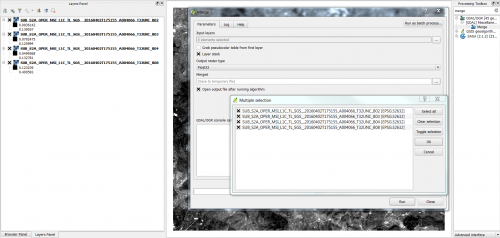
- In the processing toolbar, type merge into the search field to find the merge tool and open it.
- Click the upper ... button to select the layers you want to combine. There are different reasonable ways to combine spectral bands, depending on the information you want to obtain:
- True color (RGB=3,2,1) simulates the natural color.
- Standard false color (RGB=4,3,2) makes healthy vegetation generally appear red.
- False color (RGB=5,4,3 or 4,5,3) tends to distinguish different landcover material.
- In the Layer stack pulldown-menu, select Yes.
- Click the bottom ... button to select directory and file name to save the result. You can skip this step if you only want to save the result temporarily.
- Check the box Open output file after running algorithm (if not checked per default) and click Run. The resulting map should be added to the TOC automatically after the algorithm has finished, under the name Output layer.
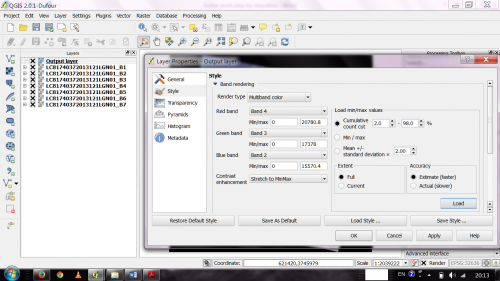
- If necessary, you can rearrange the bands by opening the layer properties and selecting the Style tab. Adjust the bands as you see fit and confirm with Apply or OK.
- For some color composites, (e.g. true color composites), the image may be enhanced by selecting Stretch to MinMax from the Contrast enhancement menu and selecting the Mean +/- standard deviation x radio button. After adjusting the standard deviation factor (a value between 1 and 2 should do), click Load and confirm with Apply or OK.

Figure A: The merge dialogue in QGIS 2.0

Figure B: The properties dialogue for a multiband raster layer in QGIS 2.0