Loading vector data
From AWF-Wiki
(Difference between revisions)
| Line 1: | Line 1: | ||
| − | # Click {{button|text=Add vector layer}} [[Image:QGIS_2.0_addvect.png|20px]] and select file ''geodata/vector/Subset-Goe_DE021L1_GOTTINGEN_UA2012_UTM32N.shp''. It is an example for a product produced by the | + | # Click {{button|text=Add vector layer}} [[Image:QGIS_2.0_addvect.png|20px]] and select file ''geodata/vector/Subset-Goe_DE021L1_GOTTINGEN_UA2012_UTM32N.shp''. It is an example for a product produced by the [Copernicus Urban Atlas project http://land.copernicus.eu/user-corner/technical-library/urban-atlas-2012-mapping-guide-new]]. The map should appear on the [[QGIS GUI|canvas]. |
# To categorize the data, click on the layer in the [[TOC]], select {{mitem|text=Properties --> Style}}. You'll find a pulldown menu which defaults to {{button|text=Single symbol}}. Click it and select {{button|text=Categorized}}. The menu will change to the {{button|text=Categorized}} view. | # To categorize the data, click on the layer in the [[TOC]], select {{mitem|text=Properties --> Style}}. You'll find a pulldown menu which defaults to {{button|text=Single symbol}}. Click it and select {{button|text=Categorized}}. The menu will change to the {{button|text=Categorized}} view. | ||
# In the {{button|text=Column}} menu, select {{button|text=CODE2012}}. In the {{button|text=Color ramp}} menu, you can select a color style. | # In the {{button|text=Column}} menu, select {{button|text=CODE2012}}. In the {{button|text=Color ramp}} menu, you can select a color style. | ||
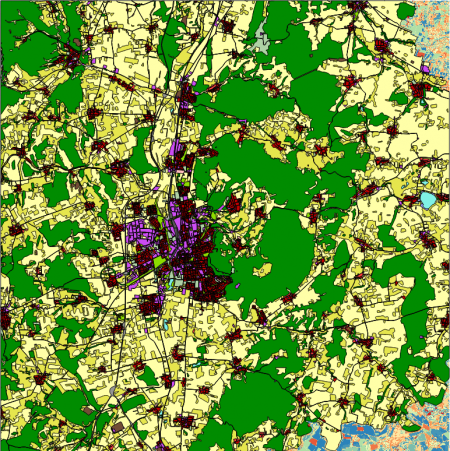
# Click {{button|text=Classify}} and confirm with {{button|text=Apply}} or {{button|text=OK}}. The map should now appear in the selected style, with a legend of the categories displayed in the [[TOC]] ('''Figure D'''). | # Click {{button|text=Classify}} and confirm with {{button|text=Apply}} or {{button|text=OK}}. The map should now appear in the selected style, with a legend of the categories displayed in the [[TOC]] ('''Figure D'''). | ||
| − | # | + | # Download a prepared QGIS style file from Stud.IP ''Subset-Goe_DE021L1_GOTTINGEN_UA2012_UTM32N.qml'' and click {{mitem|text=Style --> Load Style}}. |
| − | [[Image:Qgis_goe_urban_atlas.png|450px|thumb| | + | [[Image:Qgis_goe_urban_atlas.png|450px|thumb|left|'''Figure D''': Copernicus urban atlas landcover map for Göttingen and vicinity]] |
[[Category:Working with Vector Data]] | [[Category:Working with Vector Data]] | ||
Revision as of 22:51, 25 November 2017
- Click Add vector layer
 and select file geodata/vector/Subset-Goe_DE021L1_GOTTINGEN_UA2012_UTM32N.shp. It is an example for a product produced by the [Copernicus Urban Atlas project http://land.copernicus.eu/user-corner/technical-library/urban-atlas-2012-mapping-guide-new]]. The map should appear on the [[QGIS GUI|canvas].
- To categorize the data, click on the layer in the TOC, select Properties --> Style. You'll find a pulldown menu which defaults to Single symbol. Click it and select Categorized. The menu will change to the Categorized view.
- In the Column menu, select CODE2012. In the Color ramp menu, you can select a color style.
- Click Classify and confirm with Apply or OK. The map should now appear in the selected style, with a legend of the categories displayed in the TOC (Figure D).
- Download a prepared QGIS style file from Stud.IP Subset-Goe_DE021L1_GOTTINGEN_UA2012_UTM32N.qml and click Style --> Load Style.
