File:Landsat corr fake.png
From AWF-Wiki
(Difference between revisions)
| Line 10: | Line 10: | ||
png('landsat_corr_data.png', width=800, height=800, | png('landsat_corr_data.png', width=800, height=800, | ||
pointsize=15) | pointsize=15) | ||
| − | plot(data | + | plot(data$band.4, data$band.5, xlab='Band 4 brightness value', |
ylab='Band 5 brightness value', | ylab='Band 5 brightness value', | ||
main='Fictional example of correlation\n between two satellite bands') | main='Fictional example of correlation\n between two satellite bands') | ||
dev.off() | dev.off() | ||
Latest revision as of 11:15, 21 June 2013
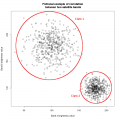
A plot of fictional correlation between brightness values of two satellite bands. Generated in R and edited with GIMP.
Code:
data <- data.frame(band.4=c(rnorm(500, mean=100, sd=20),
			    rnorm(500, mean=180, sd=10)),
		   band.5=c(rnorm(500, mean=180, sd=20),
			    rnorm(500, mean=100, sd=10)))
# and plot
png('landsat_corr_data.png', width=800, height=800,
    pointsize=15)
plot(data$band.4, data$band.5, xlab='Band 4 brightness value',
     ylab='Band 5 brightness value',
     main='Fictional example of correlation\n between two satellite bands')
dev.off()
File history
Click on a date/time to view the file as it appeared at that time.
| Date/Time | Thumbnail | Dimensions | User | Comment | |
|---|---|---|---|---|---|
| current | 11:01, 21 June 2013 |  | 800 × 800 (2.45 MB) | Lburgr (Talk | contribs) | A plot of fictional correlation between brightness values of two satellite bands. Generated in R and edited with GIMP. Code: -------------------------------------------------------------------- data <- data.frame(band.4=c(rnorm(500, mean=100, sd=20), ... |
- Edit this file using an external application (See the setup instructions for more information)
File usage
The following page links to this file: