Digitizing training and test areas
From AWF-Wiki
(Difference between revisions)
| Line 1: | Line 1: | ||
:''This article is part of the [[QGIS tutorial 2013/14]].<br/>In this article you will learn how to create test areas for landscape classification.'' | :''This article is part of the [[QGIS tutorial 2013/14]].<br/>In this article you will learn how to create test areas for landscape classification.'' | ||
| + | ==Working steps== | ||
# Generating sample points | # Generating sample points | ||
## Load the raster map ''188_pca_indices'', which should be available in the [[Course data|course data]]. | ## Load the raster map ''188_pca_indices'', which should be available in the [[Course data|course data]]. | ||
| Line 29: | Line 30: | ||
## Zoom in on a sample point (figure '''D'''). Click {{button|text=Add feature}} [[file:QGIS_2.0_Addpolygon.png|25px]] to start digitizing. Draw polygons according to the landscape classes. Simply click the desired point on the canvas to start. After selecting a second point, the third point will construct a triangle and each additional point will add another triangle to the geometry. Finish the geometry by right-clicking and entering the attributes in the appearing window (just use an increasing number for the ID). Take your time to get used to this way of digitizing -- you can always delete the last polygon by simply clicking {{button|text=Cancel}} in the attributes dialogue, or by selecting it [[file:QGIS_2.0_Select.png|25px]] and deleting with the {{button|text=Delete selected}} [[file:QGIS_2.0_Delete_selected.png|25px]] button. An example of a finished sample point can be seen in figure '''E'''. | ## Zoom in on a sample point (figure '''D'''). Click {{button|text=Add feature}} [[file:QGIS_2.0_Addpolygon.png|25px]] to start digitizing. Draw polygons according to the landscape classes. Simply click the desired point on the canvas to start. After selecting a second point, the third point will construct a triangle and each additional point will add another triangle to the geometry. Finish the geometry by right-clicking and entering the attributes in the appearing window (just use an increasing number for the ID). Take your time to get used to this way of digitizing -- you can always delete the last polygon by simply clicking {{button|text=Cancel}} in the attributes dialogue, or by selecting it [[file:QGIS_2.0_Select.png|25px]] and deleting with the {{button|text=Delete selected}} [[file:QGIS_2.0_Delete_selected.png|25px]] button. An example of a finished sample point can be seen in figure '''E'''. | ||
| + | ==Figures== | ||
{| class="wikitable" style="border: 0pt" | {| class="wikitable" style="border: 0pt" | ||
| − | | [[file:RemSens_Exercise06_01.png|thumb|450px|'''Figure A:''' Map ''188_pca_indices'' with sample points]] | + | |style="border: 0pt" | [[file:RemSens_Exercise06_01.png|thumb|450px|'''Figure A:''' Map ''188_pca_indices'' with sample points]] |
| − | | [[file:RemSens_Exercise06_02.png|thumb|450px|'''Figure B:''' Buffered sample points]] | + | |style="border: 0pt" | [[file:RemSens_Exercise06_02.png|thumb|450px|'''Figure B:''' Buffered sample points]] |
|- | |- | ||
| − | | [[file:RemSens_Exercise06_03.png|thumb|450px|'''Figure C:''' Google satellite layer loaded via the ''Open layers'' plugin]] | + | |style="border: 0pt" | [[file:RemSens_Exercise06_03.png|thumb|450px|'''Figure C:''' Google satellite layer loaded via the ''Open layers'' plugin]] |
| − | | [[file:RemSens_Exercise06_04.png|thumb|450px|'''Figure D:''' Zoom-in on buffered sample point with underlying Google satellite layer]] | + | |style="border: 0pt" | [[file:RemSens_Exercise06_04.png|thumb|450px|'''Figure D:''' Zoom-in on buffered sample point with underlying Google satellite layer]] |
|- | |- | ||
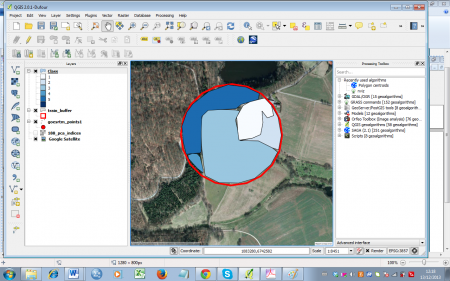
| − | | [[file:RemSens_Exercise06_05.png|thumb|450px|'''Figure E:''' Example of a sample point after digitizing landscape classes]] | + | |style="border: 0pt" | [[file:RemSens_Exercise06_05.png|thumb|450px|'''Figure E:''' Example of a sample point after digitizing landscape classes]] |
|} | |} | ||
[[Category: QGIS exercises 2013/14]] | [[Category: QGIS exercises 2013/14]] | ||
Revision as of 18:29, 24 January 2014
- This article is part of the QGIS tutorial 2013/14.
In this article you will learn how to create test areas for landscape classification.
Working steps
- Generating sample points
- Load the raster map 188_pca_indices, which should be available in the course data.
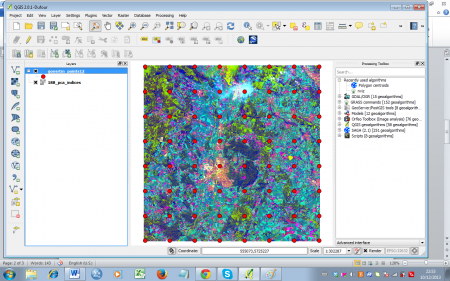
- Open Vector --> Research tools --> regular points. If not selected by default, set the Input Boundary Layer to 188_pca_indices.
- Select the radio button Use this number of points and set the number to 50.
- Set Initial set from corner (LH side)
- Enter the file name and path by clicking Browse. You may use 188_pca_indices_points as a file name.
- Confirm with OK. Let the new layer be added to the TOC (figure A).
- Buffering sample points
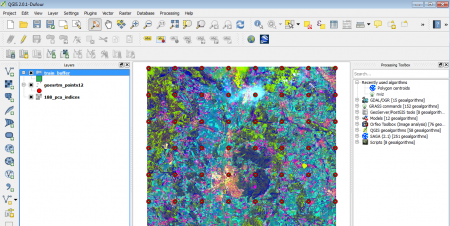
- Open Vector --> Geoprocessing tools --> Buffer. Select the generated points shapefile as input layer.
- Enter 200 (meter) as Buffer distance.
- Enter a file path and name, e.g. 188_pca_indices_buffer, confirm with OK and confirm the following dialogue to let the result be added to the project (figures B).
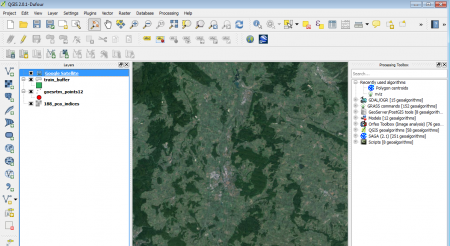
- To get an overview of the terrain, you may add a google sattelite layer
- Create a new shapefile layer
- Select Layer --> New --> New Shapefile Layer.
- As layer type, select Polygon. Click the Specify SRS button and select WGS 84/Pseudo Mercator (EPSG:3857).
- To add an attibute:
- For the attribute's name type (Class into the Name field of the New attribute section.
- Select Whole number as data type.
- Confirm with Add to attributes list.
- Confirm with OK and enter the path and name (e.g. Training) in the following menu.
- Select Layer --> New --> New Shapefile Layer.
- Digitizing areas
- Open the file digitizing_classes.pdf from the course data for a reference of landscape classes.
- Select the new shapefile in the TOC. Start the edit mode by clicking the Toggle editing button
 .
.
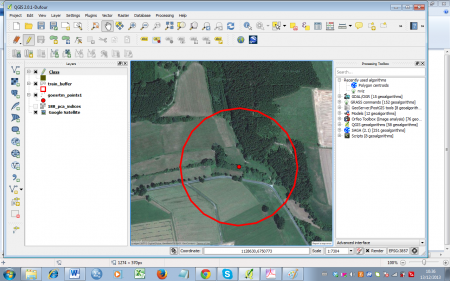
- Zoom in on a sample point (figure D). Click Add feature
 to start digitizing. Draw polygons according to the landscape classes. Simply click the desired point on the canvas to start. After selecting a second point, the third point will construct a triangle and each additional point will add another triangle to the geometry. Finish the geometry by right-clicking and entering the attributes in the appearing window (just use an increasing number for the ID). Take your time to get used to this way of digitizing -- you can always delete the last polygon by simply clicking Cancel in the attributes dialogue, or by selecting it
  and deleting with the Delete selected
  button. An example of a finished sample point can be seen in figure E.
