Plot Designs in R
(→Plot Design) |
(→Plot Design) |
||
| Line 3: | Line 3: | ||
Two different plot designs will be implemented in this lab: | Two different plot designs will be implemented in this lab: | ||
| − | # circular [[ | + | # circular [[Fixed area plots|Fixed area plots]] and |
| − | # circular [[ | + | # circular [[Fixed_area_plots#Nested_sub-plots|nested plot]] with two concentric subplots. |
Revision as of 10:05, 23 April 2015
| sorry: |
This section is still under construction! This article was last modified on 04/23/2015. If you have comments please use the Discussion page or contribute to the article! |
Contents |
Plot Design
Two different plot designs will be implemented in this lab:
- circular Fixed area plots and
- circular nested plot with two concentric subplots.
Fixed area plot
The circular fixed area plot will be implemented in a spruce (Picea abies L.) plantation stand. It is known from the inventory implemented last year that the spruce plantation stand has an estimated stem density of 980 trees/ha. As the objective is to measure on average 18 trees per plot, the planned plot radii is 7.5 m.
Nested plot
The nested plot design will be implemented in a mixed forest stand dominated by beech (Fagus sylvatica L.). According to the results of an inventory implemented last year, the total stand density is 470 trees/ha, and the cumulative basal area and diameter distribution are shown below. It was decided to have two nested subplots, and to establish the DBH threshold in the value in which the share of the total basal area measured in each subplot is the same (~ 40 cm). By using the cumulative diameter distribution, it can be seen that ~ 85 % of the total number of trees are smaller than 40 cm (~ 400 trees/ha), and ~ 15% of the total number of trees are bigger than 40 cm (~ 70 trees/ha). As the objective is to measure 9 trees per nested plot, the planned radii of each nested design are 8.5 m for the small plot, and 20 m for the large plot.
Methods
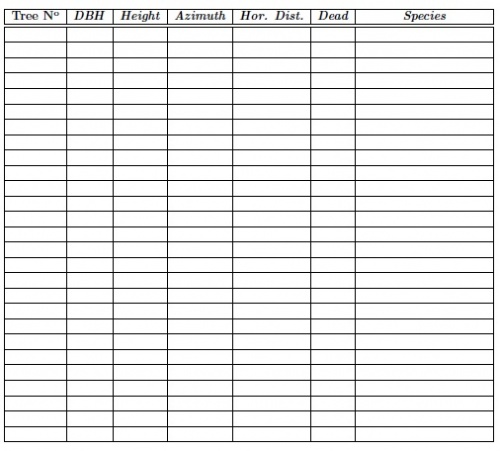
DBH (cm) will be measured in all trees bigger than 5 cm included in the plot, as well as the horizontal distance from the center of the plot (Hor.Dist. m) and the horizontal angle to the north-south direction (Azimuth, gon). Total tree height (Height, m) will be measured in 6 trees per plot. The trees to be measured in height will be selected after measuring the DBH, and the selected sample should represent all dimensional classes. Dead trees are also measured, and the state of dead or alive is recorded in the Dead column. Each student will practice with the measurement devices and actively participate in the plot measurement. The results will be recorded in the following tables. The results of this lab will be used in the lab entitled: Handling of Forest Inventory Data with R.
