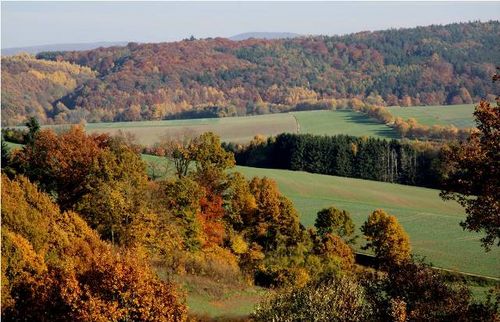
Forest diversity
(Created page with "{{construction}} __NOTOC__ Bildunterschrift '''Project Title:''' BEST Subproject IO-H2 *'''Funding:''' DFG (Core project to the Biodivers...") |
|||
| (13 intermediate revisions by 2 users not shown) | |||
| Line 1: | Line 1: | ||
| − | |||
__NOTOC__ | __NOTOC__ | ||
| − | [[file: | + | [[file:Explo1.png|right]] |
'''Project Title:''' BEST Subproject IO-H2 | '''Project Title:''' BEST Subproject IO-H2 | ||
| − | |||
*'''Funding:''' DFG (Core project to the Biodiversity Exploratories) | *'''Funding:''' DFG (Core project to the Biodiversity Exploratories) | ||
| − | |||
*'''Duration:''' 2011-2014 | *'''Duration:''' 2011-2014 | ||
| − | |||
*'''Link:''' [http://www.biodiversity-exploratories.de/startseite/ Biodiversity Exploratories] | *'''Link:''' [http://www.biodiversity-exploratories.de/startseite/ Biodiversity Exploratories] | ||
| − | + | *'''Coordination:''' Prof. Dr. Christoph Kleinn | |
| − | *'''Coordination:''' Prof. Dr. Christoph Kleinn | + | *'''Project researcher:''' Dr. Rainer Schulz and [[User:Pmagdon|Dr. Paul Magdon]] |
| − | + | *'''Study sites:''' Biodiversity Exploratories | |
| − | *'''Project researcher:''' Dr. Rainer Schulz | + | |
| − | + | ||
| − | [[ | + | |
==Background== | ==Background== | ||
| − | Based on a coherent network of [[Fixed area plots|sample plots]] distributed over the total [[forest area]] of the [http://www.biodiversity-exploratories.de/startseite/ Biodiversity Exploratories] forest variables as well as diversity indicators are assessed to estimate those target variables at landscape level. | + | [[file:Explo2.jpg|thumb|right|500px]] |
| + | Based on a coherent network of [[Fixed area plots|sample plots]] distributed over the total [[forest Definition|forest area]] of the [http://www.biodiversity-exploratories.de/startseite/ Biodiversity Exploratories] forest variables as well as diversity indicators are assessed to estimate those target variables at landscape level. | ||
===Extension of the monitoring concept using a systematic grid of sample plots=== | ===Extension of the monitoring concept using a systematic grid of sample plots=== | ||
To statistically ensure conclusions on the effects of different forest | To statistically ensure conclusions on the effects of different forest | ||
| Line 32: | Line 26: | ||
diversity development at landscape level. | diversity development at landscape level. | ||
===Regionalization=== | ===Regionalization=== | ||
| − | + | The regionalization of essential indicator variables for forest biodiversity is realized based on the data of the [[systematic sampling|systematic inventory]]. Target variables in that context are e.g. tree species, [[stand density]] and [[biomass functions and carbon estimation|above-ground biomass]]. Remote sensing data (digital aerial photographs, [[RapidEye]] satellite images) play a central role in the derivation of area-wide estimations in form of maps of important biodiversity variables. The [[regionalization]] provides information that also enables other projects to better explain relationships between management types (and intensities) and [[Forest diversity|forest diversity]]. | |
| − | + | ||
| − | The | + | |
| − | + | ||
==Project Goals== | ==Project Goals== | ||
Latest revision as of 15:49, 27 February 2014
Project Title: BEST Subproject IO-H2
- Funding: DFG (Core project to the Biodiversity Exploratories)
- Duration: 2011-2014
- Link: Biodiversity Exploratories
- Coordination: Prof. Dr. Christoph Kleinn
- Project researcher: Dr. Rainer Schulz and Dr. Paul Magdon
- Study sites: Biodiversity Exploratories
[edit] Background
Based on a coherent network of sample plots distributed over the total forest area of the Biodiversity Exploratories forest variables as well as diversity indicators are assessed to estimate those target variables at landscape level.
[edit] Extension of the monitoring concept using a systematic grid of sample plots
To statistically ensure conclusions on the effects of different forest management intensities on biodiversity of forests on the scale level of the Exploratories the existing forest inventory concept is extended. The starting point in that context represents the implementation of a long-term sampling-, plot- and estimation design allowing to address the variability of estimated parameters as well as the estimation accuracy. Forest mensurational variables, indicators of structure and biodiversity, and variables addressing quantity and quality of regeneration and dead wood are assessed. The systematic inventory design on the total forest area of the Exploratories offers the possibility for repeated assessments of the variables and by this allows for a continued estimation of forest diversity development at landscape level.
[edit] Regionalization
The regionalization of essential indicator variables for forest biodiversity is realized based on the data of the systematic inventory. Target variables in that context are e.g. tree species, stand density and above-ground biomass. Remote sensing data (digital aerial photographs, RapidEye satellite images) play a central role in the derivation of area-wide estimations in form of maps of important biodiversity variables. The regionalization provides information that also enables other projects to better explain relationships between management types (and intensities) and forest diversity.
[edit] Project Goals
- to make regional assessments of biomass, tree diversity and management as one main basis for selection of the experimental plots
- to inventory the selected experimental plots with respect to tree and species distribution

