Introduction to Monteverdi2
Monteverdi is an open source remote sensing image processing software developed by CNES. The goal is to develop an easy to use and friendly interface for non-specialists who want access to the software tools being part of the OTB-Applications package. In the meantime more and more users started to use this application for a complete processing workflow (ortho-rectification, segmentation, classification, etc.) instead of using commercial software. One of the advantages is that Monteverdi uses multi-threading functionalities and so the applications run very fast and in addition it has the capability to handle large images.
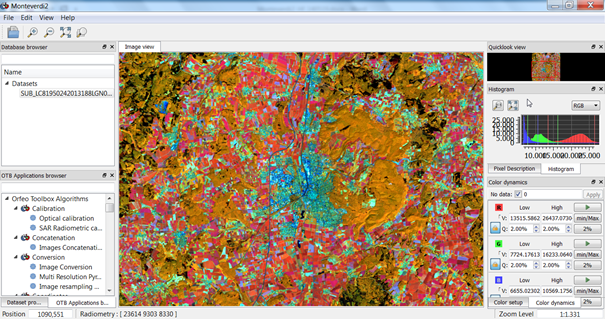
Monteverdi2 GUI
From this window you have access to the different modules of the Orfeo Toolbox algorithm library. Below the main menu you can see your loaded data in the database browser.
Open an image
To open an image click File > import image. Because of an automatic detection of image extensions you can easily select raster files just by browsing your computer. The selection of a file format is not necessary. In the current Monteverdi2 version vector data cannot be loaded into the database browser but can be accessed by the file chooser of various Orfeo Toolbox modules.
Visualize an image
The visualization module in the current Monteverdi2 version allows to display only raster data. If you load a multiband raster file you can create different RGB compositions and perform simple image enhancements using linear histogram stretching. After loading and highlighting an image in the database browser and it is shown in the image view. To navigate quickly left click and drag inside the entire scene. Zooming in and out is easy by using a mouse wheel.
The “Pixel Description tab” displays position and a digital numbers (in case of multiband of the current pixel. You can select the pixel from the “full resolution window” or you can enter the coordinates manually.
The “histogram tab” shows you the dynamic of the displayed layer. By default, the dynamic of each layer is modified by clamping the histogram at min+2% and max−2%. Change the colorization of the layer by moving the lines with left mouse button.
