File:6.3.3-fig111.png
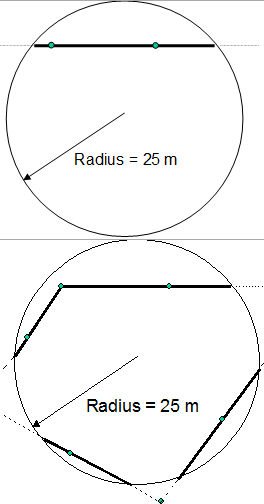
Example for mapping forest boundary on circular plots: forest edges are surveyed on 25m radius plots that intersect with the forest boundary. One plot is assumed to contain a maximum of two border lines that are to be measured. If the forest boundary is a straight line within the plot (above), two points on that line at a minimum distance of 10m from each other were surveyed by azimuth and distance from the plot centre so that the position of the line relative to the circular plot could be recovered and the edge length within the plot calculated. If the forest boundary was not a straight line, then the polygon corner was surveyed from the plot centre and one point on each line (below). While corner points of the forest edge polygon may also be surveyed outside the plot area, the length is only calculated for the sections inside the plot (bold lines).
Reference:
Kleinn C. and G. Kändler. Submitted. Estimating forest edge length from large area forest inventory data ‑ the example of the German National Forest Inventory. Submitted to CJFR.</ref>).]]
File history
Click on a date/time to view the file as it appeared at that time.
| Date/Time | Thumbnail | Dimensions | User | Comment | |
|---|---|---|---|---|---|
| current | 00:19, 17 March 2011 | | 264 × 504 (391 KB) | Aspange (Talk | contribs) | Example for mapping forest boundary on circular plots: forest edges are surveyed on 25m radius plots that intersect with the forest boundary. One plot is assumed to contain a maximum of two border lines that are to be measured. If the forest boundary is a |
- Edit this file using an external application (See the setup instructions for more information)
File usage
The following page links to this file: