Training data selection (SCP)
(→Creating systematic sampling grid) |
|||
| Line 86: | Line 86: | ||
|} | |} | ||
| − | ==Creating systematic sampling grid== | + | ==Creating systematic sampling grid== |
* Use a processing toolbox model downloaded from here [http://www.gwdg.de/~hfuchs/qgis/urban_atlas_systematic_sample.model urban_atlas_systematic_sample.model] (Right click, Save as ..). Make sure to save the with the extension ''*.model''. | * Use a processing toolbox model downloaded from here [http://www.gwdg.de/~hfuchs/qgis/urban_atlas_systematic_sample.model urban_atlas_systematic_sample.model] (Right click, Save as ..). Make sure to save the with the extension ''*.model''. | ||
* Open the {{mitem|text=Processing --> Toolbox}} and {{mitem|text= Models --> Tools --> Add model from file}}. Load the previously downloaded model. | * Open the {{mitem|text=Processing --> Toolbox}} and {{mitem|text= Models --> Tools --> Add model from file}}. Load the previously downloaded model. | ||
| Line 95: | Line 95: | ||
* Click {{button|text=OK}} | * Click {{button|text=OK}} | ||
| + | ==Stratified random sampling== | ||
[[category:QGIS Tutorial]] | [[category:QGIS Tutorial]] | ||
Revision as of 15:19, 19 April 2018
Defining land use/cover classes
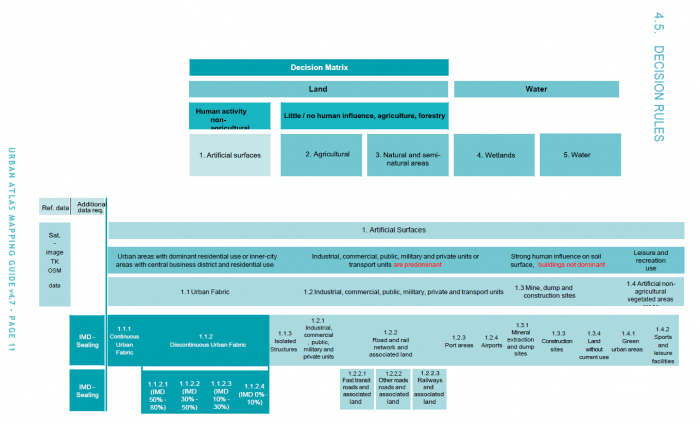
Before starting to map land cover classes using Sentinel-2 satellite images we need clear definitions and a classification scheme. An example for a hierarchical land use and land cover (LUC) classification scheme is the European Urban Atlas. The scheme defines 5 meta classes where the class 1. Artificial surfaces has many sub classes as shown in figure A.
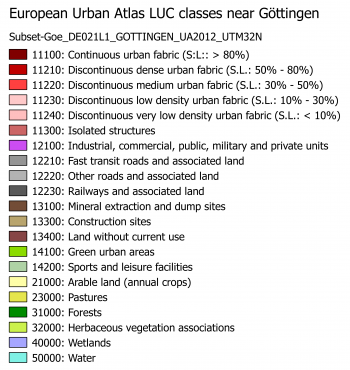
The specification of other meta classes is not as detailed. If we are more interested in forest and open area classes we need to adapt and modify this scheme. On the lowest level not all classes defined in the European Urban Atlas do also appear in the surroundings of Göttingen (figure B). In addition we need to consider the phenolgical development of vegetation at specific acquisiton dates and to specify more classes which can possibly be identified in multispectral feature space of the satellite image. An example of an adapted simplified scheme is shown in the table below.
| MC ID | MC info | C ID | C info | RGB code |
|---|---|---|---|---|
| 1 | Artificial surfaces | 11 | Built-up | 230-77-0 |
| 2 | Agricultural | 21 | Arable land | 255-255-168 |
| 2 | Agricultural | 22 | Bare soil | 253-191-111 |
| 2 | Agricultural | 23 | Pasture | 230-230-77 |
| 3 | Natural and semi-natural areas | 31 | Broad leaved tree cover | 128-255-0 |
| 3 | Natural and semi-natural areas | 32 | Coniferous tree cover | 128-255-0 |
| 4 | Wetlands | 41 | Reed | 128-255-0 |
| 5 | Water | 51 | Water | 128-242-230 |
| 9 | Miscellaneous | 91 | No data (cloud) | 255-255-255 |
| 9 | Miscellaneous | 92 | No data (shadow) | 0-0-0 |
| 9 | Miscellaneous | 93 | No data (missing imagery) | 0-0-0 |
Creating systematic sampling grid
- Use a processing toolbox model downloaded from here urban_atlas_systematic_sample.model (Right click, Save as ..). Make sure to save the with the extension *.model.
- Open the Processing --> Toolbox and Models --> Tools --> Add model from file. Load the previously downloaded model.
- The model should appear in the Models tab.
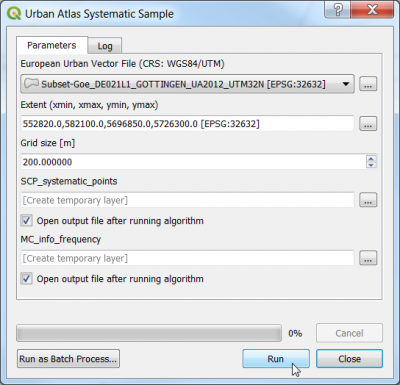
- Double click to open the model.
- Specify an original European Urban Vectors layer for Göttingen: geodata_lab01\vector\DE021L1_GOTTINGEN\Subset-Goe_DE021L1_GOTTINGEN_UA2012_UTM32N.shp or download data from other European cities.
- Click OK


