Stratified sampling examples
(→Example 1) |
(→Example 1) |
||
| Line 5: | Line 5: | ||
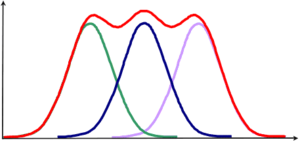
Imagine the example population of <math>N=30</math> elements be subdivided into three strata as in figure 1. Here, stratification has been done arbitrarily into three strata of size 14, 8 and 8. From this stratified population, we wish to take a sample of <math>n=10</math>, taking <math>n_1=4</math> from the first stratum and <math>n_2=n_3=3</math> from the other two strata. The stratum parametric means and variances are given in Table 1. | Imagine the example population of <math>N=30</math> elements be subdivided into three strata as in figure 1. Here, stratification has been done arbitrarily into three strata of size 14, 8 and 8. From this stratified population, we wish to take a sample of <math>n=10</math>, taking <math>n_1=4</math> from the first stratum and <math>n_2=n_3=3</math> from the other two strata. The stratum parametric means and variances are given in Table 1. | ||
| − | '''Table 1 | + | '''Table 1''' Stratum parameters for the stratified example population. |
<blockquote> | <blockquote> | ||
| Line 41: | Line 41: | ||
| − | '''Table 2 | + | '''Table 2''' Calculation of parametric population mean from the parametric strata means. |
<blockquote> | <blockquote> | ||
Revision as of 19:52, 16 December 2010
Example 1
Imagine the example population of \(N=30\) elements be subdivided into three strata as in figure 1. Here, stratification has been done arbitrarily into three strata of size 14, 8 and 8. From this stratified population, we wish to take a sample of \(n=10\), taking \(n_1=4\) from the first stratum and \(n_2=n_3=3\) from the other two strata. The stratum parametric means and variances are given in Table 1.
Table 1 Stratum parameters for the stratified example population.
Stratum \(N_h\,\) \(n_h\,\) \(\mu_h\,\) \(\sigma_h^2\,\) 1 14 4 6.29 3.49 2 8 3 10.13 4.86 3 8 3 5.38 2.48 Calculation in stratified sampling is best done in tabular format, first per stratum and then combining the per-stratum results to the values / estimations for the entire population. The estimation of the mean is illustrated in Table 2 and results – as expected – in the parametric mean without stratification. Table 3 presents the calculation of the parametric error variance for \(n=10\) and the defined allocation of samples to the three strata.
Table 2 Calculation of parametric population mean from the parametric strata means.
Stratum Stratum mean Weight \((W_h)\) mean*weight 1 6.29 0.466667 2.9333 2 10.13 0.266667 2.7000 3 5.38 0.266667 1.4333 7.0667
sorry: This section is still under construction! This article was last modified on 12/16/2010. If you have comments please use the Discussion page or contribute to the article!

