Search results
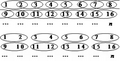
File:5.5.6.4-fig91.png Building pairs of neighboring observations for the approximation of error variance in systematic sampling.(305 × 155 (139 KB)) - 11:12, 23 December 2010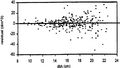
File:2.8.4-fig39.png ...me (<math>dm^3</math> as Y-axis and ''dbh'' (cm) as X-axis showing unequal variance across ''dbh'' classes(599 × 339 (596 KB)) - 20:46, 1 March 2011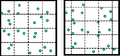
File:4.8-fig69.png ... both cases; but this is not the case for the per-plot parametric mean and variance.(470 × 219 (302 KB)) - 20:32, 9 March 2011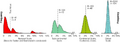
File:3.7-fig44.png ... larger population but with exactly the same characteristics like mean and variance), then the 10% sample produces considerably much more precise results!(859 × 304 (767 KB)) - 22:27, 9 March 2011


