First-order texture
From AWF-Wiki
(Difference between revisions)
| (10 intermediate revisions by one user not shown) | |||
| Line 1: | Line 1: | ||
| − | + | Local statistical moments (Mean, Variance, Skewness, Kurtosis) calculated on every pixel in the selected channel of the input image, over a specified neighborhood are called ''first-order'' textures. | |
| − | a pixel | + | * In the search engine of the Processing Toolbox, type '''Local Statistic''' and select '''LocalStatisticExtraction''' under Feature Extraction of OTB. |
| + | * Under the Parameters tab, select a single band or a multiband file as input layer. | ||
| + | * In case of a multiband file select the band number. | ||
| + | * Select '''3''' as '''Neighborhood radius''' in pixels. | ||
| + | [[File:Qgis_texture_Localstatistics.png|400px]] | ||
| + | |||
| + | The output image (Fig. B) is a multiband with 4 statistical moments per band in the order: | ||
| + | # Mean | ||
| + | # Variance | ||
| + | # Skewness | ||
| + | # Kurtosis | ||
| + | The standard deviation of grey levels in a region in the neighborhood of a pixel can be calculated by a GRASS GIS modul: | ||
* In the search engine of the Processing Toolbox, type '''neighbors''' and select '''r.neighbors''' under Raster of GRASS GIS 7 commands. | * In the search engine of the Processing Toolbox, type '''neighbors''' and select '''r.neighbors''' under Raster of GRASS GIS 7 commands. | ||
* Under the Parameters tab, select a single band file as input layer. | * Under the Parameters tab, select a single band file as input layer. | ||
| Line 8: | Line 19: | ||
[[File:Qgis_texture_stdev.png|400px]] | [[File:Qgis_texture_stdev.png|400px]] | ||
{| class="wikitable" | {| class="wikitable" | ||
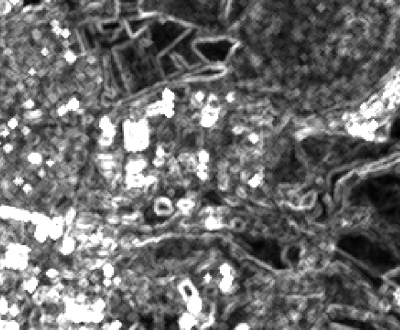
| − | |style="border: 0pt" | [[file:Qgis_campus_synthesis.png|thumb|left|400px|'''Figure A:''' Input image: Sentinel-2 | + | |style="border: 0pt" | [[file:Qgis_campus_synthesis.png|thumb|left|400px|'''Figure A:''' Input image: Sentinel-2 luminance image based on 4 10m bands, (University Göttingen Campus North)]] |
| − | |style="border: 0pt" | [[file: | + | |style="border: 0pt" | [[file:Qgis_campus_firstorder_texture.png|thumb|center|400px|'''Figure B:''' Output image: First-order textures of Sentinel-2 luminance image RGB=Skewness, Variance, Mean (University Göttingen Campus North)]] |
| + | |style="border: 0pt" | [[file:Qgis_campus_stdev.png|thumb|center|400px|'''Figure C:''' Output image: Standard deviation texture of Sentinel-2 luminance image (University Göttingen Campus North)]] | ||
|} | |} | ||
[[category:Spatial Filtering]] | [[category:Spatial Filtering]] | ||
Latest revision as of 22:31, 29 November 2020
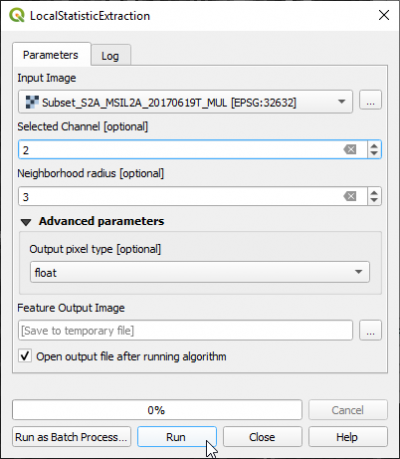
Local statistical moments (Mean, Variance, Skewness, Kurtosis) calculated on every pixel in the selected channel of the input image, over a specified neighborhood are called first-order textures.
- In the search engine of the Processing Toolbox, type Local Statistic and select LocalStatisticExtraction under Feature Extraction of OTB.
- Under the Parameters tab, select a single band or a multiband file as input layer.
- In case of a multiband file select the band number.
- Select 3 as Neighborhood radius in pixels.
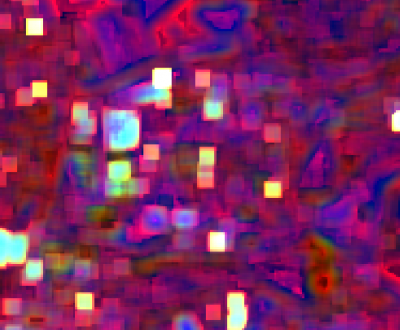
The output image (Fig. B) is a multiband with 4 statistical moments per band in the order:
- Mean
- Variance
- Skewness
- Kurtosis
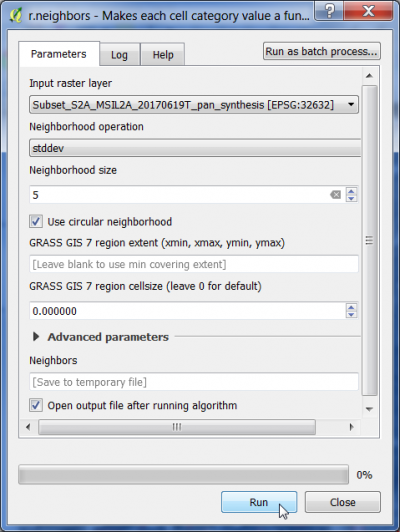
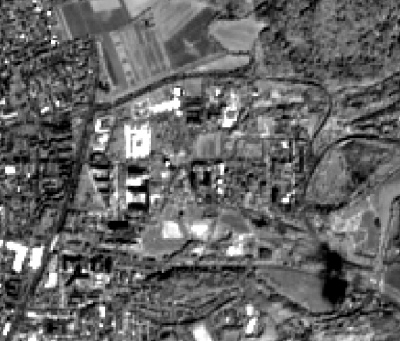
The standard deviation of grey levels in a region in the neighborhood of a pixel can be calculated by a GRASS GIS modul:
- In the search engine of the Processing Toolbox, type neighbors and select r.neighbors under Raster of GRASS GIS 7 commands.
- Under the Parameters tab, select a single band file as input layer.
- Select stddev from the drop-down list Neighborhood operation.
- Select an odd integer number as Neighborhood size in pixels.
- Tick Use circular neighborhood.
