Cloud masking
From AWF-Wiki
Sentinel-2 cloud and cloud shadow masking
The exclusion of clouds and cloud shadow is an important processing step which is usually done in an early preprocessing stage. The Sentinel-2 products are annotated with Quality Indicators (QI_DATA). In the Level 2A product you may find a file in the folder QI_DATA with the extension _CLD_20m.jp2 (data type: 8bit unsigned integer, spatial resolution 20m) which might be used for masking clouds. The data range is from 0 for high confidence clear sky to 100 for high confidence cloudy (for more details see L2A Product Definition Document).
- Load a multiband Sentinel-2 satellite image (Level 2-A product) Changing Raster Layer Style to display a true color and a false color composite.
- Zoom in to a cloudy part of the image and compare the extent of cloud and cloud shadow in both composites. Which composite is better for displaying clouds?


- The original single band cloud quality indicator band is included in this specifc multiband file as band No. 13. Follow Split stack to extract this band.
- Overlay the QI Cloud band on top of the color composites. Use the Identify Feature Tool for requesting pixel values of the QI band file inside a cloud. Which values represent clouds?
- In (Layer Properties Style load Load the full data range (minimum/maximum values) ). Then change the Style to a Pseudocolor map with interpolation discrete and 10 equal interval classes as shown in the screenshot.
- Double click on a color field of some classes (Layer Properties Style) to open the change color window. Change the opacity from 100% to 0%. Find the best threshold for clouds.


- Create a binary cloud mask (bitmask) where clouds = 1 and non-clouds = 0. Use the Processing tool Orfeo Toolbox --> Miscellaneous --> Band Math. Tick the single band QI layer in the Input Image list list. You may write a conditional ifelse expression using lazy operators. Type into the Expression field: (im1b1>30)?1:0. If pixel values of band 1 of multiband image 1 are larger than 30 then replace with 1 otherwise replace with 0. Mark the output layer in the TOC and click
 to stretch the histogram to view extents.
 ]
]
- Apply a circular majority filter with a radius of 7 pixels. Open the Processing tool SAGA Toolbox --> Raster filter --> Majority filter. The input Grid is the Output image of the band math operation step. Change the Search mode to Circle with an radius of 7 pixels. Mark the 'Filtered Grid in the TOC and click to stretch the histogram to view extents.

- Open the Processing tool Ordeo Toolboy --> Feature Extraction --> BinaryMorphologicalOperation (dilate). Choose the Filtered Grid as input image. The structuring element type is ball with a radius of 9 pixels. Mark the 'Feature Output Image in the TOC and click to stretch the histogram to view extents.

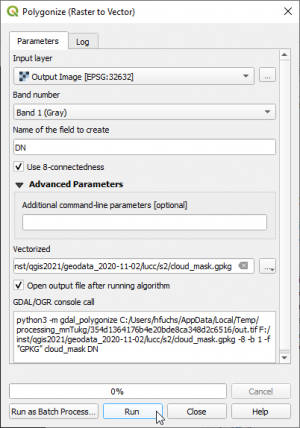
- Convert the Feature Output Imge from raster to vector format. Raster --> Conversion --> Polygonize. Select an output file name for vector polygons.

- Change the display of the Layer properties --> Style --> Single Symbol --> Fill Style to No Brush'. Toggle
 editing
  of the resulting vector polygon layer. Select polygons
  which are misclassified as clouds and delete them pressing Del on your keyboard. Save your edits
  .
.