Changing Raster Layer Style
The raster layer propertiers differ from the vector layer properties, due to the significant differences of the data. You can open this dialog by double-clicking a raster layer in the TOC or right-clicking on the layer in the TOC and choosing Properties.
Contents |
Render Type: Multiband color
- True color (RGB=3,2,1) simulates the natural color.
- Standard false color (RGB=4,3,2) makes healthy vegetation generally appear red.
- False color (RGB=5,4,3 or 4,5,3) tends to distinguish different landcover material.
- In the Layer stack pulldown-menu, select Yes.
- Click the bottom ... button to select directory and file name to save the result. You can skip this step if you only want to save the result temporarily.
- Check the box Open output file after running algorithm (if not checked per default) and click Run. The resulting map should be added to the TOC automatically after the algorithm has finished, under the name Output layer.
- If necessary, you can rearrange the bands by opening the layer properties and selecting the Style tab. Adjust the bands as you see fit and confirm with Apply or OK (figure B).
- For some color composites, (e.g. true color composites), the image may be enhanced by selecting Stretch to MinMax from the Contrast enhancement menu and selecting the Mean +/- standard deviation x radio button. After adjusting the standard deviation factor (a value between 1 and 2 should do), click Load and confirm with Apply or OK.

Render Type: Singleband gray
- A grayscale image is an image with a pixel depth of 8 bit, which means that eight bits are used to represent a single pixel. In QGIS we have the possibility to display raster maps in grayscale via the raster layer properties. See also “Grayscale” on Wikipedia
It makes sense to display a map in greyscale if only one band is available. By default, the scale is calculated by QGIS based on the map itself. Common satellite bands have a data range from 0 to 255.
- When displayed in grayscale, 0 is interpreted as black and 255 as white.
In QGIS we can also use the standard deviation of the raster pixels to calculate the scale. In connection with contrast enhancement (the option “Stretch to MinMax” does a good job) this can give a better result, as the scale is not affected by extreme pixel values.
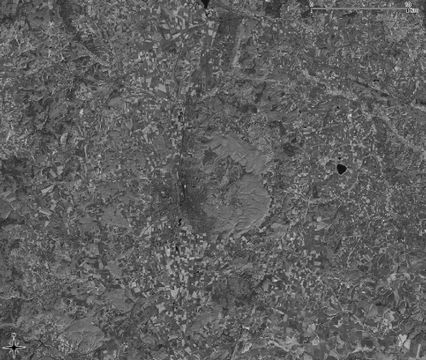
Band 4 of a LANDSAT image in grayscale. Most pixels have a very low value, resulting in a dark display.
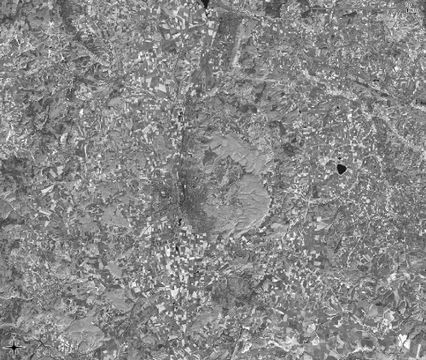
The same image in grayscale based on standard deviation (2.50) and contrast enhancement.


Render Type: Singleband pseudocolor
- Pseudocolor is not to be mistaken for false color, the latter one being a composite of three bands. See also: Pseudocolor in Wikipedia
Pseudocolor is a way to display a raster map in which the color scale is derived from a single grayscale band. In QGIS it can be found in the raster layer properties. It can be a good alternative to grayscale if it comes to display metric data like elevation or temperature.
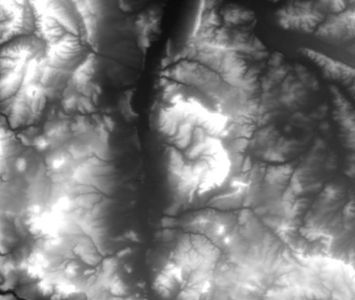
A DEM (digital elevation model) displayed in grayscale.
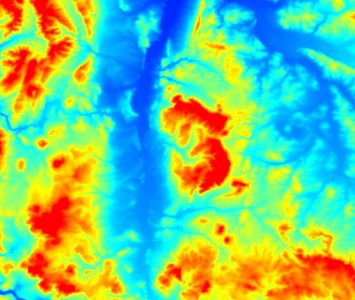
The same DEM displayed in pseudocolor.

