SAR flood mapping with SNAP
In this tutorial we will use Level-1 Ground Range Detected (GRD) Sentinel-1 data downloaded from the Copernicus Open Access Hub. The example data is from a study area in Nigeria near the city of Lokoja in Kogi province near the junction of the two large rivers Niger and Benue. During the westafrican monsoon April - September heavy rainfall and floods occur.
Contents |
Data transfer
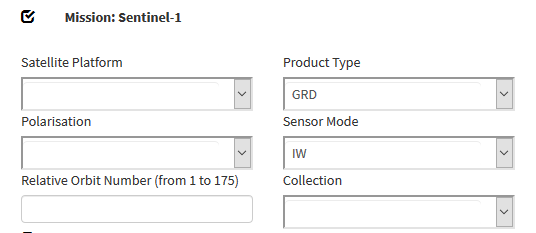
Download example tutorial data from Nigeria or data from your personal region of interest: two Sentinel-1 scenes one pre-event acquisition date and one post-event date: Downloading Sentinel-2 images. Select Product type GRD with VV polarization.
Visualization of amplitude bands
- Open SNAP Desktop.
- Drag and drop the zip files of the Sentinel-2 scenes into the TOC of Product Explorer.
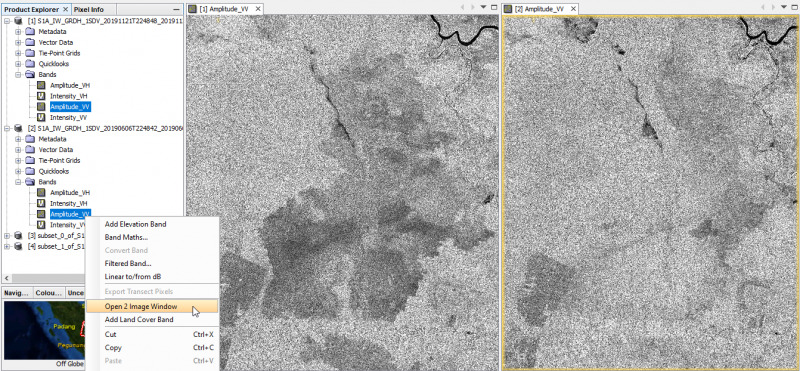
- Unfold the product folders and Mark the Aplitude_VV bands of both products.
- Right click Open 2 Image Window.
- Windows --> Tile Horizontally. Both Amplitude bands are shown side by side geometrically linked to each other. The geometry ist still in ascending sensor coordinates.
Subsetting
Open SNAP Desktop.
Drag and drop the zip files of the Sentinel-2 scenes into the TOC.
We need to reduce the amount data by subsetting the large Sentinel-1 scenes.
Zoom out and activate the Rectangel Drawing Tool ![]()

