Loading raster data
From AWF-Wiki
- Click the Add raster layer button
 and select the file sub_L71195024_02420050623_B40.TIF from geodata/raster/landsat/landsat457.
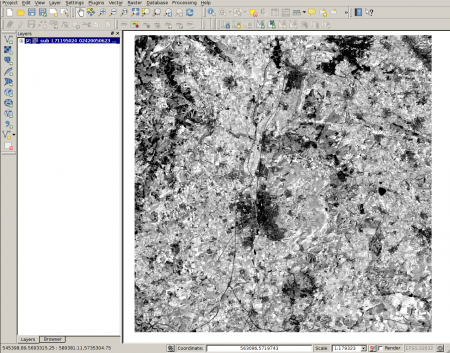
- After clicking Open, the map should appear on the QGIS canvas (figure A).
- Adjust the appearance of the image by right-clicking on the map in the TOC and selecting Properties --> Transparency --> Adjust global transparency scale percentage and confirming with Apply or OK. When clicking Apply, the menu will stay open and you may still change the settings.
- Use the tools for zooming in and zooming out to increase or decrease the map scale
 .
.
- Use the panning tool to move the map in the desired direction. If you get lost while moving the map around, you can always zoom back to the map by clicking the Zoom to layer button
 .
.
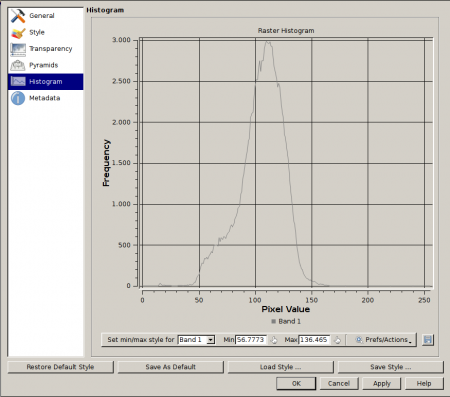
- To generate a histogram of pixel values, right click the map in the TOC and select Properties --> Histogram. The histogram should appear as in figure B.
- To change map color and symbology, again select the layer in the TOC with a right click and select Properties --> Style. From the pulldown menu Render type, select Singleband pseudocolor. A different menu will come up, where you may select the style of the color map in the section Generate new color map. Click classify and confirm with Apply or OK. The map should now appear in the selected style (figure C).

