Fixed area plots
From AWF-Wiki
| sorry: |
This section is still under construction! This article was last modified on 03/3/2011. If you have comments please use the Discussion page or contribute to the article! |
Forest Inventory lecturenotes
Category Forest Inventory lecturenotes not found
Contents |
General observations

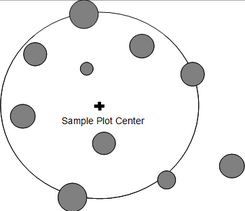
Figure 1 With circular sample plots all trees are taken as sample trees that are within a defined distance (radius) from the sample point, which constitutes the plot center (Kleinn 2007[1]).

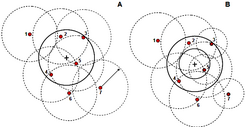
Figure 2 Illustration of the inclusion zone approach: For fixed area circular plots, the inclusion zones are identical for all trees. Those trees are taken as sample trees in whose inclusion zones the sample point comes to lie (Kleinn 2007[1]).

Figure 3 Typical diameter distribution in a natural forest (Kleinn 2007[1]).

Figure 4 Nested sub-plots showing 3 circular plots having different sizes, radii, but sharing same plot center (Kleinn 2007[1]).

Figure 5 Comparison of the inclu-sion zone approach for nested circular sub-plots (B) and for fixed circu-lar plots (A) (Kleinn 2007[1]).
[[File:4.2.2-fig51.png|right|thumb|245px|Figure 6 Different combination of shapes for nested sub-plots (after Prodan et al. 1997Cite error: Closing </ref> missing for <ref> tag
Cite error:
<ref> tags exist, but no <references/> tag was found