Spectral indices
From AWF-Wiki
Vegetation index using the Raster Calculator
- Click the Add raster layer
 and select a multiband Sentinel-2 satellite image
- Check the rank and spectral range of bands in the multiband file (e.g. see table Changing Raster Layer Style).
- After clicking Open, the raster layer appears in the QGIS canvas.
- Click Raster --> Raster calculator.
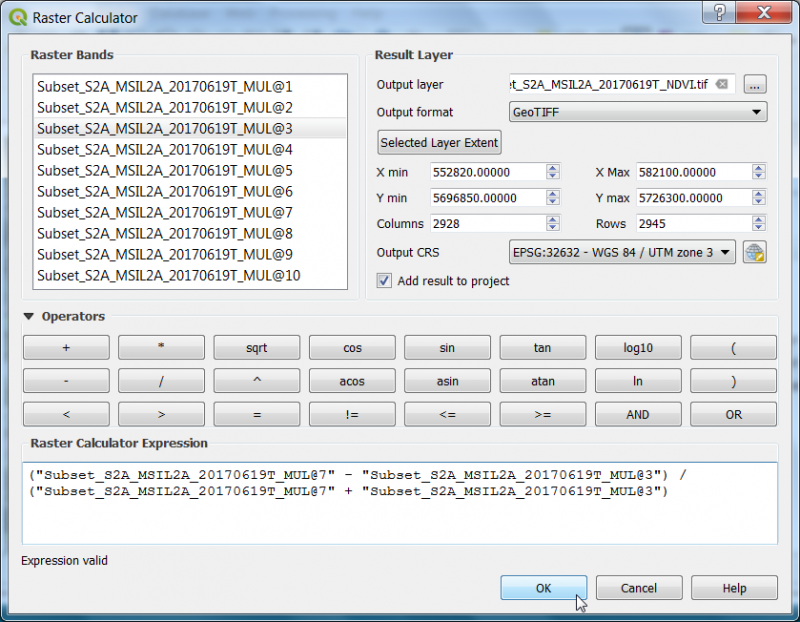
- A powerful normalization is realized by the normalized difference vegetation index that forms the basis of most vegetation indices $NDVI = (Nir - Red) / (Nir + Red)$. It can be implemented using Raster Calculator as seen in the following screenshot:
- Define path and file name of the output layer. OK.
- Map visualization: Open the raster layer properties by right-clicking the ndvi raster in the TOC selecting Properties, or by simply double clicking.
- Select the Style tab. Under Render type select Singleband pseudocolor.
- In the Generate new color map section select RdYlGn. In the Mode pulldown menu select Equal interval. Set the number of Classes to 10 and click Classify.
- To finish, click Apply.
Spectral indices using OTB
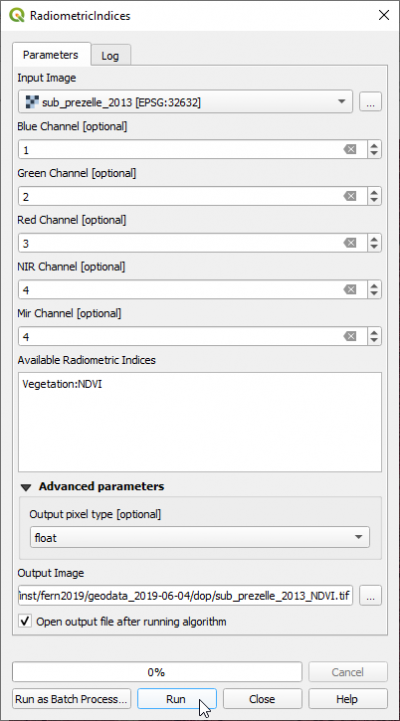
A convinient module for calculating spectral indices can be found in the processing toolbar. Type Radiometric into the search field and find the Orfeo Toolbox --> Feature Extraction --> Radiometric Indices) tool. Open it with a double click.
Assign the spectral ranges to the right order of bands in the multiband file. Choose ndvi from the Available Radiometric Indices drop-down list. OK.

