Accuracy assessment
| Line 9: | Line 9: | ||
There are several characteristics that can be obtained by a confusion matrix: | There are several characteristics that can be obtained by a confusion matrix: | ||
| − | [[File:confusion_matrix.png| | + | |
| + | [[File:confusion_matrix.png|400px]] | ||
| + | |||
* '''Classification errors of omission (exclusion) and commission (inclusion)''' | * '''Classification errors of omission (exclusion) and commission (inclusion)''' | ||
** Number of elements that are wrongly excluded or included to a certain category | ** Number of elements that are wrongly excluded or included to a certain category | ||
Revision as of 14:32, 1 February 2016
| sorry: |
This section is still under construction! This article was last modified on 02/1/2016. If you have comments please use the Discussion page or contribute to the article! |
For decision making, based on a map, the map has to be accurate or, at least, the accuracy has to be known.
Therefore, accuracy assessment gives information about the quality of a map created by remotely sensed data.
Besides the quality, an accuracy assessment is realised to identify possible sources of errors and as an indicator used in comparisons of e.g. algorithms wtc.
Contents |
Confusion Matrix
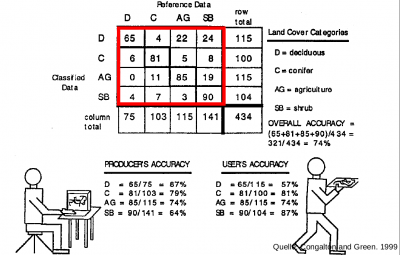
A confusion matrix compare the relationship between known reference data and the results of the classification, based on the classes.
There are several characteristics that can be obtained by a confusion matrix:
- Classification errors of omission (exclusion) and commission (inclusion)
- Number of elements that are wrongly excluded or included to a certain category
- Overall accuracy
- Indicates the quality of the map classification
- Can be calculated by dividing the total number of correctly classified pixels by the total number of reference pixels
- Producer's accuracy
- Indicates the quality of the classification of training set pixels
- Can be calculated by dividing the correctly classified pixels in each category by the number of training set pixels of the corresponding category
- User's accuracy
- Indicates the probability that prediction represent reality
- Can be calculated by dividing the correctly classified pixels in each category by the total number of pixels that were classified in that category
It has to be recognized, that the confusion matrix is based on training data and, therefore, this procedure only indicates how well the statistics extracted from these areas can be used to cateogrize the same areas.
Implementation in QGIS
GRASS
Orfeo Toolbox
Semi-automatic classification plugin
Literature
Congalton, R. G. & Green, K. (2008). Assessing the accuracy of remotely sensed data: principles and practices. CRC press.
Lillesand, T., Kiefer, R. W. & Chipman, J. (2008). Remote sensing and image interpretation. John Wiley & Sons.
