SAR flood mapping with SNAP
(→Radiometric and geometric calibration) |
|||
| (21 intermediate revisions by 2 users not shown) | |||
| Line 1: | Line 1: | ||
| − | In this tutorial we will use Level-1 Ground Range Detected (GRD) Sentinel-1 data downloaded from the Copernicus Open Access Hub. | + | In this tutorial we will use Level-1 Ground Range Detected (GRD) Sentinel-1 data downloaded from the Copernicus Open Access Hub. Download the example data from Stud.IP. It is from a study area in Nigeria near the city of Lokoja in Kogi province near the junction of the two large rivers Niger and Benue. During the westafrican monsoon April - September heavy rainfall and floods occur. |
=Data transfer= | =Data transfer= | ||
| Line 8: | Line 8: | ||
=Visualization of amplitude bands= | =Visualization of amplitude bands= | ||
* Open SNAP Desktop. | * Open SNAP Desktop. | ||
| − | * Drag and drop the zip files of the Sentinel- | + | * Drag and drop the zip files of the Sentinel-1 scenes into the TOC of Product Explorer. |
* Unfold the product folders and Mark the Aplitude_VV bands of both products. | * Unfold the product folders and Mark the Aplitude_VV bands of both products. | ||
* Right click '''Open 2 Image Window'''. | * Right click '''Open 2 Image Window'''. | ||
| − | * {{mitem|text=Windows --> Tile Horizontally}}. Both Amplitude bands are shown side by side geometrically linked to each other. | + | * {{mitem|text=Windows --> Tile Horizontally}}. Both Amplitude bands are shown side by side geometrically linked to each other. Make sure the option {{mitem|text=View --> Synchronise Image View}} and {{mitem|text=View --> Synchronise Image Cursors}}is activated). |
| − | [[File: | + | [[File:snap_dual_view.png|800px]] |
=Subsetting= | =Subsetting= | ||
| − | + | We need to reduce the data volume by subsetting the large Sentinel-1 scenes. | |
| − | + | ||
| − | We need to reduce the | + | |
| − | + | ||
* Activate the Rectangle Drawing Tool [[File:snap_box_drawing.png]] | * Activate the Rectangle Drawing Tool [[File:snap_box_drawing.png]] | ||
* Left click and drag a rectangular box in the viewer to mark a subset area. | * Left click and drag a rectangular box in the viewer to mark a subset area. | ||
| Line 30: | Line 27: | ||
* Click {{button|text=Load}} and browse to the graph file ''\geodata_lokoja\01_lokoja_subset.xml''' | * Click {{button|text=Load}} and browse to the graph file ''\geodata_lokoja\01_lokoja_subset.xml''' | ||
* Click on the '''Subset''' tab and activate '''Geographic Coordinates'''. | * Click on the '''Subset''' tab and activate '''Geographic Coordinates'''. | ||
| − | * Paste the WKT string into the text field below the world map: CTRL + V. | + | * Paste the WKT string into the text field '''below''' the world map: CTRL + V. |
* Check if the extent of the subset is displayed correctly onto the world map. | * Check if the extent of the subset is displayed correctly onto the world map. | ||
* Click {{button|text=Update}} to apply the box coordinates. | * Click {{button|text=Update}} to apply the box coordinates. | ||
| − | |||
[[File:snap_subset_graph.png|600px]] | [[File:snap_subset_graph.png|600px]] | ||
| Line 40: | Line 36: | ||
* Click {{button|text=Run}}. | * Click {{button|text=Run}}. | ||
* Click the '''Read''' tab. | * Click the '''Read''' tab. | ||
| − | * Choose the | + | * Choose the pre-event Sentinel-1 source product (2018-04-01) from the drop down list. |
* Click {{button|text=Run}}. | * Click {{button|text=Run}}. | ||
| − | * | + | * Repeat the worksteps above creating a subset for the post-event image (2019-09-16). |
| − | + | ||
=Radiometric and geometric calibration= | =Radiometric and geometric calibration= | ||
| − | {{mitem|text=File --> Open product}}. Browse to | + | {{mitem|text=File --> Close all products}} from previous steps. |
| + | {{mitem|text=File --> Open product}}. Browse to subset files resulting from previous work step with prefix '''Subset_''' and extension '''_Orb.dim''' (pre-event and post-event subsets). | ||
* Open {{mitem|text=Tools --> GraphBuilder}}. | * Open {{mitem|text=Tools --> GraphBuilder}}. | ||
* Click {{button|text=Load}} and browse to the graph file ''\geodata_lokoja\02_lokoja_calibration.xml'''. | * Click {{button|text=Load}} and browse to the graph file ''\geodata_lokoja\02_lokoja_calibration.xml'''. | ||
| − | + | [[File:snap_graph_calibration.png|600px]] | |
| − | + | ||
* Click the '''Read''' tab. | * Click the '''Read''' tab. | ||
| − | * Choose the | + | * Choose the pre-event Sentinel-1 source product with prefix '''Subset_''' and extension '''_Orb'''. |
* Click {{button|text=Run}}. | * Click {{button|text=Run}}. | ||
| + | * Click the '''Write''' tab. Adjust the output directory to you local path. Make sure that the file name matches the input pre-event product. | ||
| + | * Click {{button|text=Run}}. | ||
| + | * Repeat the same for the post-event Sentinel-1 subset. Make sure that file names match for reading and writing! | ||
=Change composite= | =Change composite= | ||
| − | * Click {{button|text=Load}} and browse to the graph file ''\geodata_lokoja\03_lokoja_change_composite.xml'''. | + | * Click {{button|text=Load}} and browse to the graph file ''\geodata_lokoja\03_lokoja_change_composite.xml''. |
| + | [[File:snap_graph_composite.png|600px]] | ||
| + | * Click the '''Write''' tab. Adjust the output directory to you local path. | ||
| + | * {{button|text=Run}}. | ||
| + | * Open QGIS. | ||
| + | * {{mitem|text=Data Source Manger --> Browser --> XYZ Tiles --> Google Satellite}} | ||
| + | * Load the change compoisite file with extension '''_Stack.tif''' {{mitem|text=Data Source Manger --> Raster}}. | ||
| + | * Adjust opacity of the change layer on top of Google Satellite. {{mitem|text=Layer Properties --> Transparency --> Global Transparency}}. | ||
| + | [[File:snap_change_composite.png|600px]] | ||
[[Category:SNAP Tutorial]] | [[Category:SNAP Tutorial]] | ||
[[Category:Tutorials]] | [[Category:Tutorials]] | ||
Latest revision as of 14:06, 25 January 2021
In this tutorial we will use Level-1 Ground Range Detected (GRD) Sentinel-1 data downloaded from the Copernicus Open Access Hub. Download the example data from Stud.IP. It is from a study area in Nigeria near the city of Lokoja in Kogi province near the junction of the two large rivers Niger and Benue. During the westafrican monsoon April - September heavy rainfall and floods occur.
Contents |
[edit] Data transfer
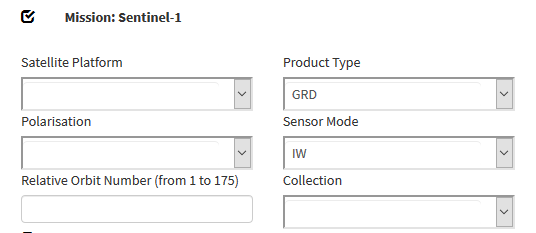
Download example tutorial data from Nigeria or data from your personal region of interest: two Sentinel-1 scenes one pre-event acquisition date and one post-event date: Downloading Sentinel-2 images. Select Product type GRD with VV polarization.
[edit] Visualization of amplitude bands
- Open SNAP Desktop.
- Drag and drop the zip files of the Sentinel-1 scenes into the TOC of Product Explorer.
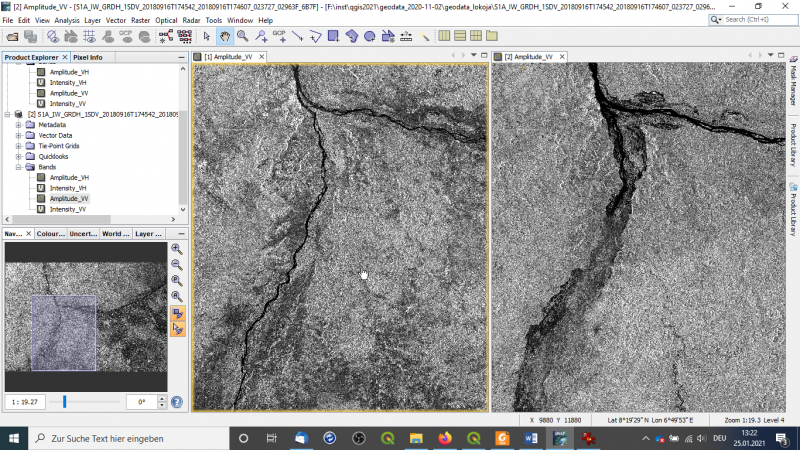
- Unfold the product folders and Mark the Aplitude_VV bands of both products.
- Right click Open 2 Image Window.
- Windows --> Tile Horizontally. Both Amplitude bands are shown side by side geometrically linked to each other. Make sure the option View --> Synchronise Image View and View --> Synchronise Image Cursorsis activated).
[edit] Subsetting
We need to reduce the data volume by subsetting the large Sentinel-1 scenes.
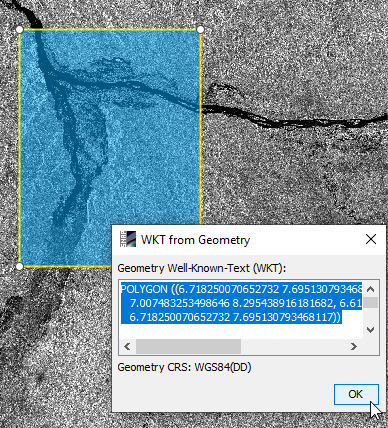
- Activate the Rectangle Drawing Tool

- Left click and drag a rectangular box in the viewer to mark a subset area.
- Activate the selection tool
 and mark the box in the viewer.
- Right click WKT from Geometry.
- Copy the WKT string: CTRL + C.
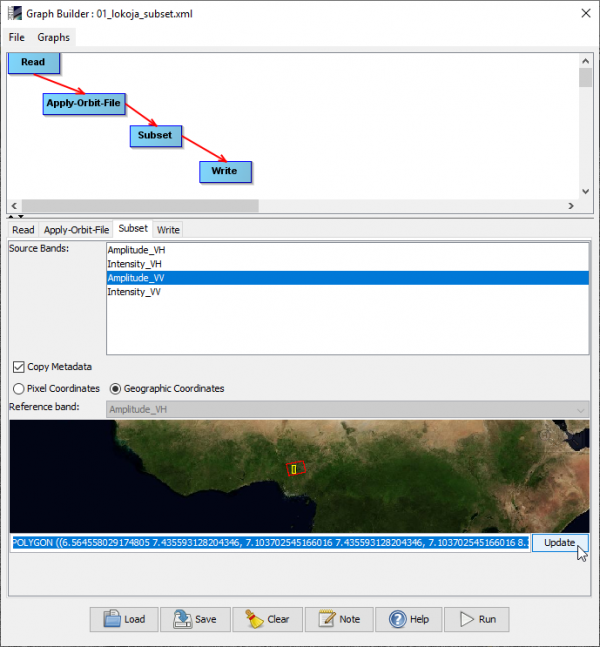
- Open Tools --> GraphBuilder.
- Click Load and browse to the graph file \geodata_lokoja\01_lokoja_subset.xml'
- Click on the Subset tab and activate Geographic Coordinates.
- Paste the WKT string into the text field below the world map: CTRL + V.
- Check if the extent of the subset is displayed correctly onto the world map.
- Click Update to apply the box coordinates.
- Click the Write tab. Adjust the output directory to you local path.
- Click Run.
- Click the Read tab.
- Choose the pre-event Sentinel-1 source product (2018-04-01) from the drop down list.
- Click Run.
- Repeat the worksteps above creating a subset for the post-event image (2019-09-16).
[edit] Radiometric and geometric calibration
File --> Close all products from previous steps. File --> Open product. Browse to subset files resulting from previous work step with prefix Subset_ and extension _Orb.dim (pre-event and post-event subsets).
- Open Tools --> GraphBuilder.
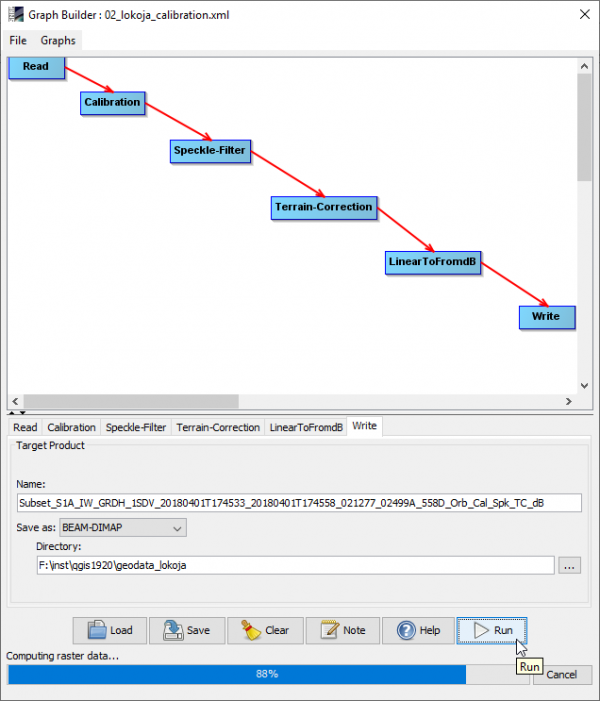
- Click Load and browse to the graph file \geodata_lokoja\02_lokoja_calibration.xml'.
- Click the Read tab.
- Choose the pre-event Sentinel-1 source product with prefix Subset_ and extension _Orb.
- Click Run.
- Click the Write tab. Adjust the output directory to you local path. Make sure that the file name matches the input pre-event product.
- Click Run.
- Repeat the same for the post-event Sentinel-1 subset. Make sure that file names match for reading and writing!
[edit] Change composite
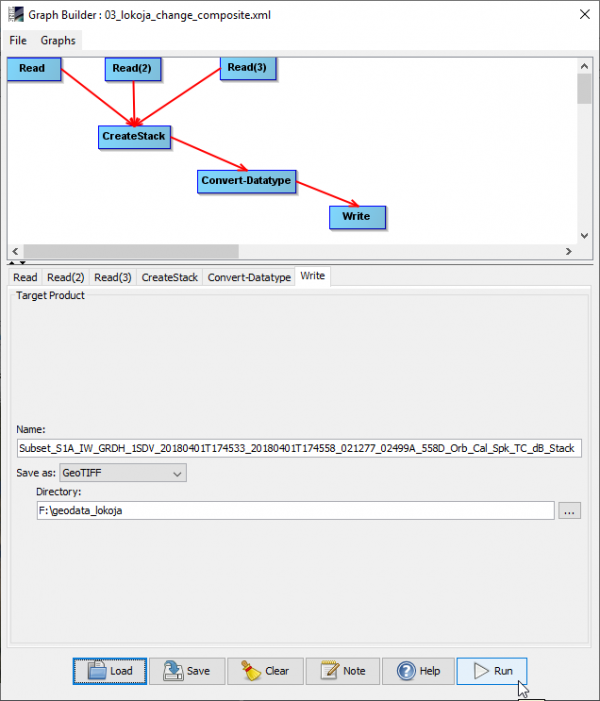
- Click Load and browse to the graph file \geodata_lokoja\03_lokoja_change_composite.xml.
- Click the Write tab. Adjust the output directory to you local path.
- Run.
- Open QGIS.
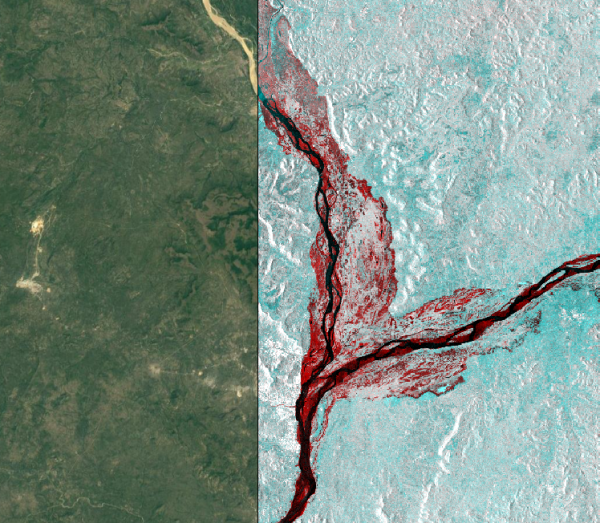
- Data Source Manger --> Browser --> XYZ Tiles --> Google Satellite
- Load the change compoisite file with extension _Stack.tif Data Source Manger --> Raster.
- Adjust opacity of the change layer on top of Google Satellite. Layer Properties --> Transparency --> Global Transparency.
