Spectral indices
From AWF-Wiki
(Difference between revisions)
(→Several spectral indices at once using OTB) |
|||
| (52 intermediate revisions by one user not shown) | |||
| Line 1: | Line 1: | ||
| − | = | + | = Spectral vegetation index using Raster Calculator = |
| − | + | * Click the {{button|text=Open Data Source Manager}} [[Image:QGIS_3.0_datasource.png|30px]] and then {{button|text=Add raster layer}} [[Image:QGIS_2.0_addrast.png|20px]] and select the file ''/geodata/lucc/s2/Subset_S2A_MSIL2A_20170619T_MUL.tif''. | |
| − | + | * Check the rank and spectral range of bands in the multiband file (e.g. see table [[Changing Raster Layer Style]]). Here the rank of 10 bands is B2,B3,B4,B5,B6,B7,B8,B8A,B11,B12. | |
| − | + | * Click {{mitem|text=Raster --> Raster calculator}}. | |
| − | + | * A powerful normalization is realized by the ''normalized difference vegetation index'' that forms the basis of most vegetation indices $NDVI = (Nir - Red) / (Nir + Red)$. It can be implemented using {{tool|text=Raster Calculator}} as seen in the following screenshot: | |
| − | + | ||
[[File:Qgis_raster_calc_ndvi.png|600px]] | [[File:Qgis_raster_calc_ndvi.png|600px]] | ||
| − | + | * Define path and file name of the output layer. {{button|text=OK}}. | |
| − | + | * Map visualization: Open the raster layer properties by right-clicking the ndvi raster in the [[TOC]] selecting {{button|text=Properties}}, or by simply double clicking. | |
| − | + | * Select the {{button|text=Symbology}} tab. Under '''Render type''' select {{button|text=Singleband pseudocolor}}. | |
| − | + | ** Open the the pulldown menu of {{button|text=Color ramp}} by clicking on [[File:Qgis_pull_down.png]] Select {{mitem|text= All color ramps --> RdYlGn}}. Under {{button|text=Mode}} select {{button|text=Equal interval}}. Set the number of {{button|text=Classes}} to 10. In the pulldown menu of {{button|text=Color ramp}} select {{mitem|text=Invert Color Ramp}}. | |
| − | + | ||
| + | ** To finish, click {{button|text=Apply}} (see '''Fig. A'''). | ||
| + | |||
| + | = Several spectral indices at once using OTB = | ||
| + | A convenient module for calculating one or several spectral indices at the same time can be found in the QGIS processing toolbox. | ||
| + | * Type {{typed|text=Radiometric}} into the search field and find the {{button|text=OTB --> Feature Extraction --> Radiometric Indices}} tool. | ||
| + | * Open it with a double click. | ||
| + | * Assign the bands in the multiband file to the correct spectral sensitivity. | ||
| + | * If you want to calculate a single spectral index type in the text field ''Available Radiometric Indices'': {{typed|text="Vegetation:NDVI"}} | ||
| + | * If you want to calculate several spectral indices at once and store them in a multiband file click {{button|text=Help}} to find definitions of available spectral indices in three categories (vegetation, soil, water) and relevant channels of the input multiband image. | ||
| + | * In the text field ''Available Radiometric Indices'' type with apostrophs: | ||
| + | {{typed|text="Vegetation:NDVI Water:NDWI2 Soil:BI2"}} | ||
| + | * Click {{button|text=Run}}. | ||
| + | |||
| + | [[File:Qgis_radiometric_composite.png|left|400px]] | ||
| − | |||
| − | |||
| − | |||
| − | |||
| − | |||
| − | |||
| − | |||
| − | |||
| − | |||
| − | |||
{| class="wikitable" | {| class="wikitable" | ||
| − | | style="border: 0pt" | [[file:Qgis_ndvi_pseudo.png|thumb|left|400px|'''Figure A:''' Single band | + | | style="border: 0pt" | [[file:Qgis_ndvi_pseudo.png|thumb|left|400px|'''Figure A: ''' Single band '''NDVI''' (color table = RdYlGn)]] |
| − | | style="border: 0pt" | [[file:Qgis_vi_composite.png|thumb|left|400px|'''Figure B:''' | + | | style="border: 0pt" | [[file:Qgis_vi_composite.png|thumb|left|400px|'''Figure B: '''Spectral composite (RGB = NDVI,BI2,NDWI)]] |
|} | |} | ||
[[Category:Working with Raster Data]] | [[Category:Working with Raster Data]] | ||
| + | [[Category:QGIS Tutorial]] | ||
| + | [[Category:Tutorials]] | ||
Latest revision as of 18:03, 14 June 2021
[edit] Spectral vegetation index using Raster Calculator
- Click the Open Data Source Manager
 and then Add raster layer
  and select the file /geodata/lucc/s2/Subset_S2A_MSIL2A_20170619T_MUL.tif.
- Check the rank and spectral range of bands in the multiband file (e.g. see table Changing Raster Layer Style). Here the rank of 10 bands is B2,B3,B4,B5,B6,B7,B8,B8A,B11,B12.
- Click Raster --> Raster calculator.
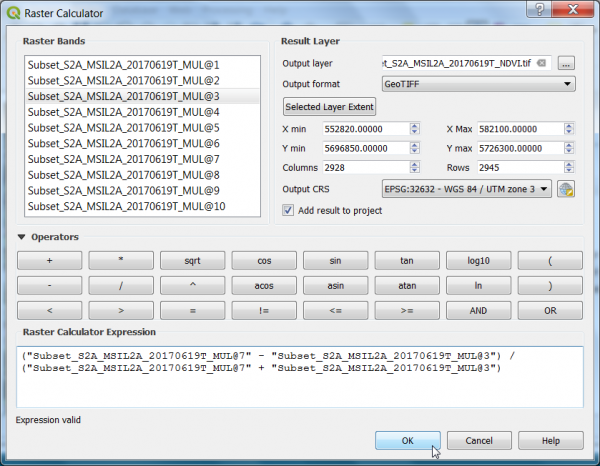
- A powerful normalization is realized by the normalized difference vegetation index that forms the basis of most vegetation indices $NDVI = (Nir - Red) / (Nir + Red)$. It can be implemented using Raster Calculator as seen in the following screenshot:
- Define path and file name of the output layer. OK.
- Map visualization: Open the raster layer properties by right-clicking the ndvi raster in the TOC selecting Properties, or by simply double clicking.
- Select the Symbology tab. Under Render type select Singleband pseudocolor.
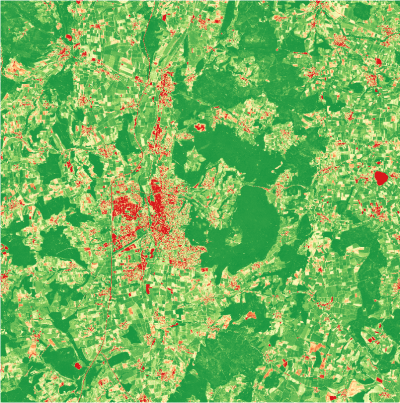
- To finish, click Apply (see Fig. A).
[edit] Several spectral indices at once using OTB
A convenient module for calculating one or several spectral indices at the same time can be found in the QGIS processing toolbox.
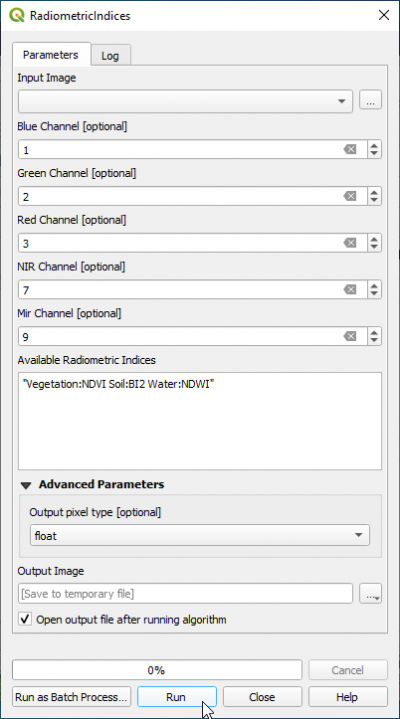
- Type Radiometric into the search field and find the OTB --> Feature Extraction --> Radiometric Indices tool.
- Open it with a double click.
- Assign the bands in the multiband file to the correct spectral sensitivity.
- If you want to calculate a single spectral index type in the text field Available Radiometric Indices: "Vegetation:NDVI"
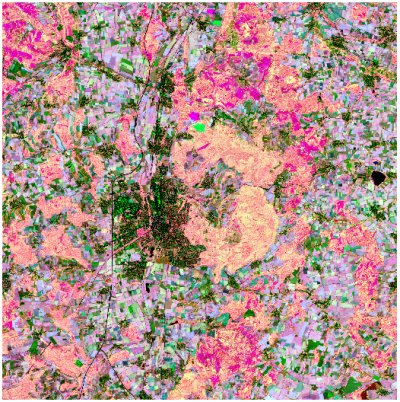
- If you want to calculate several spectral indices at once and store them in a multiband file click Help to find definitions of available spectral indices in three categories (vegetation, soil, water) and relevant channels of the input multiband image.
- In the text field Available Radiometric Indices type with apostrophs:
"Vegetation:NDVI Water:NDWI2 Soil:BI2"
- Click Run.


