Exercise: Mapping storm damaged forest areas
(→Definition of storm damage) |
(→Digitizing windthrow areas) |
||
| (54 intermediate revisions by 2 users not shown) | |||
| Line 1: | Line 1: | ||
==Definition of storm damage== | ==Definition of storm damage== | ||
| − | Mapping of forest damages caused by storms using visual interpretation of very high resolution digital ortho photos (DOP) | + | Mapping of forest damages caused by storms using visual interpretation of very high resolution digital ortho photos (DOP) needs clear definitions and characteristics which are usually documented as interpretation key. |
Here, clearings are defined with a | Here, clearings are defined with a | ||
minimum area = 0.2ha, | minimum area = 0.2ha, | ||
| − | minimum width = 20m, | + | minimum width = 20m, and a tree crown cover < 10%. |
| − | + | ||
| − | Characteristics of windthrow areas depend on the time between storm events and the availabiltiy of optical remote sensing images but also on the status and progress of logging and clearing operations at the time of | + | Characteristics of windthrow areas depend on the time between storm events and the availabiltiy of optical remote sensing images but also on the status and progress of logging and clearing operations at the time of image acquisition. |
Typical characteristics for recognizing storm damages are: | Typical characteristics for recognizing storm damages are: | ||
horizontal complete trees with root plates, root plates, stumps with fresh cross section, piles of logs for storage / skidding, piles of branches, skid roads and tracks, no or few ground vegetation. | horizontal complete trees with root plates, root plates, stumps with fresh cross section, piles of logs for storage / skidding, piles of branches, skid roads and tracks, no or few ground vegetation. | ||
| − | ==Digitizing of a windthrow area== | + | ==Digitizing windthrow areas== |
| + | |||
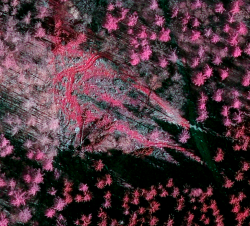
| + | [[Image:windthrow1.png|250px|thumb|right|'''Figure A''': Clearing in a false color composite of a digital orthophoto (DOP20)]] | ||
| + | [[Image:windthrow2.png|250px|thumb|right|'''Figure B''': Digitized boundary of a clearing based on a digital orthophoto (DOP20)]] | ||
| + | |||
| + | # Create a new shapefile layer | ||
| + | ## Select {{mitem|text=Layer --> Create Layer --> New Geopackage Layer}}. | ||
| + | ## Define path and name of a file. | ||
| + | ##* As Geometry type, select {{button|text=Polygon}}. Click the {{button|text=Specify CRS}} button and select WGS84/UTM32N (EPSG:32632). | ||
| + | ##* To add an attibute: | ||
| + | ##** For the attribute's name type {{typed|text=Class}} into the {{button|text=Name}} field of the {{button|text=New attribute}} section. | ||
| + | ##** Select {{button|text=Whole number (integer)}} as data type. | ||
| + | ##** Confirm with {{button|text=Add to Fields List}}. | ||
| + | # Configure Digitizing options | ||
| + | ## Select {{mitem|text=Project --> Snapping options}}. | ||
| + | ## Activate Snapping clicking on the left button. | ||
| + | ## Change {{button|text=All Layers}} to {{button|text=Advanced Configuration}} | ||
| + | ## Activate one or several vector layers for which you wish to configure snapping. | ||
| + | ## Change '''Type''' from {{button|text=vertex}} to {{button|text=vertex and segment}}. | ||
| + | ## Choose '''Units''' {{button|text=meters}}. | ||
| + | ## Select the snapping '''Tolerance''' {{typed|text=0.5}}. | ||
| + | ## Activate the checkbox '''Avoid''' overlap. | ||
| + | ## Activate {{button|text=Topological Editing}} and {{button|text=Snapping on Intersection}} | ||
| + | [[file:Qgis_snap_opt.png|400px]] | ||
| + | # Digitizing areas | ||
| + | ## Mark the new GeoPackage File in the Layers window. Start editing by clicking the {{button|text=Toggle editing}} button [[file:QGIS_2.0_Edit.png|25px]]. | ||
| + | ## Zoom in on a cleared area in the forest (Fig. '''A'''). Click {{button|text=Add feature}} [[file:QGIS_2.0_Addpolygon.png|25px]] to start digitizing. Draw polygons according to the definition of clearings. Simply click the desired point on the canvas to start. After selecting a second point, the third point will construct a triangle and each additional point will add another vertex to a polygon. Finish the geometry by right-clicking and entering the attributes in the appearing window (Use Class = 1 in case of a windthrow area). If you reach the border of the map viewer you can press the space button to pan the spatial extent and continue without interrupting the digitizing mode. Take your time to get used to this way of digitizing -- you can always delete the last polygon by simply clicking {{button|text=Cancel}} in the attributes dialogue, or by selecting it [[file:QGIS_2.0_Select.png|25px]] and deleting with the {{button|text=Delete selected}} [[file:QGIS_2.0_Delete_selected.png|25px]] button. Do not forget to save your changes by clicking [[file:Qgis_save_edits.png|25px]] or the {{button|text=Toggle editing}} button [[file:QGIS_2.0_Edit.png|25px]]! Confirm {{button|text=Save}} to stop editing and save the changes permanently. | ||
| + | ## Change the display style of the new polygon. Select the shapefile in the Layers window. {{mitem|text=Layer --> Properties --> Style --> Single Symbol}}. Click on "Simple fill" and change the Fill style: diagonal, Border width: 0.5, and the colors of "Colors Fill" and "Borders" according to your preferences. An example of a finished polygon can be seen in Fig. '''B'''. | ||
| + | |||
==Estimating area and perimeter== | ==Estimating area and perimeter== | ||
| + | |||
| + | # Make sure that the edit mode of the vector polygon layer is switched off. | ||
| + | # {{mitem|text=Vector --> Geometry Tools --> Export/Add geometry columns}}. Select the vector layer clearings and click {{button|text=OK}} and {{button|text=Yes}}. Close the dialog with {{button|text=OK}} and {{button|text=Close}}. | ||
| + | # Select the clearing layer in the layers window. Right click {{button|text=Open Attribute table}}. Report area of the clearing in hectares and perimeter in meters. | ||
| + | |||
| + | ==Using Google Maps for digitizing== | ||
| + | [[Image:windthrow3.png|350px|thumb|right|'''Figure C''': Digitized boundary of a clearing based on Google Maps using the Openlayers plugin]] | ||
| + | |||
| + | Web map services (WMS) like Google Maps, Bing Maps, Yahoo Maps and OpenStreemap use a special projected coordinate reference system called "Pseudo Mercator" or "Web Mercator". | ||
| + | |||
| + | # Select {{mitem|text=Web --> OpenLayers plugin --> Google Maps --> Google Satellite}}. Of course, you can also add a hybrid layer or try the layers from other providers. | ||
| + | #* If the Plugin doesn't exist you'll first have to install the Openlayers plugin using {{mitem|text=Plugins --> Manage and install plugins}}. | ||
| + | |||
| + | A new Layer ''Google Maps'' is loaded into the layers window. The project CRS is automatically set to WGS84/Pseudo Mercator (EPSG:3857). Check the actual project CRS {{mitem|text=Project --> Project Properties --> CRS}}, the checkbox 'on the fly' transformation is switched on. The EPSG code of the actual project CRS is also displayed on the lower right below the viewer. | ||
| + | # Select a raster or a vector layer from your region of interest in the layers window, right click {{mitem|text=Zoom to layer extent}}. | ||
| + | # Select the vector layer ''clearing'' and toggle the digitizing mode on (s.a.). Continue to digitize clearings but now using Google Maps as reference (Fig. '''C'''). | ||
| + | # Calculate area and perimeter of your polygon layer (s.a.) Important to note that the Layer CRS must defined as a metric CRS (eg. UTM) not as WGS84/Pseudo Mercator (EPSG:3857), otherwise you get wrong results for area and perimeter! | ||
| + | |||
| + | [[category:Forestry Application]] | ||
Latest revision as of 14:30, 21 June 2019
Contents |
[edit] Definition of storm damage
Mapping of forest damages caused by storms using visual interpretation of very high resolution digital ortho photos (DOP) needs clear definitions and characteristics which are usually documented as interpretation key. Here, clearings are defined with a minimum area = 0.2ha, minimum width = 20m, and a tree crown cover < 10%.
Characteristics of windthrow areas depend on the time between storm events and the availabiltiy of optical remote sensing images but also on the status and progress of logging and clearing operations at the time of image acquisition. Typical characteristics for recognizing storm damages are: horizontal complete trees with root plates, root plates, stumps with fresh cross section, piles of logs for storage / skidding, piles of branches, skid roads and tracks, no or few ground vegetation.
[edit] Digitizing windthrow areas
- Create a new shapefile layer
- Select Layer --> Create Layer --> New Geopackage Layer.
- Define path and name of a file.
- As Geometry type, select Polygon. Click the Specify CRS button and select WGS84/UTM32N (EPSG:32632).
- To add an attibute:
- For the attribute's name type Class into the Name field of the New attribute section.
- Select Whole number (integer) as data type.
- Confirm with Add to Fields List.
- Configure Digitizing options
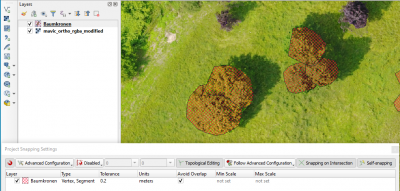
- Select Project --> Snapping options.
- Activate Snapping clicking on the left button.
- Change All Layers to Advanced Configuration
- Activate one or several vector layers for which you wish to configure snapping.
- Change Type from vertex to vertex and segment.
- Choose Units meters.
- Select the snapping Tolerance 0.5.
- Activate the checkbox Avoid overlap.
- Activate Topological Editing and Snapping on Intersection
- Digitizing areas
- Mark the new GeoPackage File in the Layers window. Start editing by clicking the Toggle editing button
 .
.
- Zoom in on a cleared area in the forest (Fig. A). Click Add feature
 to start digitizing. Draw polygons according to the definition of clearings. Simply click the desired point on the canvas to start. After selecting a second point, the third point will construct a triangle and each additional point will add another vertex to a polygon. Finish the geometry by right-clicking and entering the attributes in the appearing window (Use Class = 1 in case of a windthrow area). If you reach the border of the map viewer you can press the space button to pan the spatial extent and continue without interrupting the digitizing mode. Take your time to get used to this way of digitizing -- you can always delete the last polygon by simply clicking Cancel in the attributes dialogue, or by selecting it
  and deleting with the Delete selected
  button. Do not forget to save your changes by clicking
  or the Toggle editing button
  ! Confirm Save to stop editing and save the changes permanently.
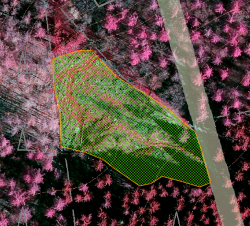
- Change the display style of the new polygon. Select the shapefile in the Layers window. Layer --> Properties --> Style --> Single Symbol. Click on "Simple fill" and change the Fill style: diagonal, Border width: 0.5, and the colors of "Colors Fill" and "Borders" according to your preferences. An example of a finished polygon can be seen in Fig. B.
- Mark the new GeoPackage File in the Layers window. Start editing by clicking the Toggle editing button
[edit] Estimating area and perimeter
- Make sure that the edit mode of the vector polygon layer is switched off.
- Vector --> Geometry Tools --> Export/Add geometry columns. Select the vector layer clearings and click OK and Yes. Close the dialog with OK and Close.
- Select the clearing layer in the layers window. Right click Open Attribute table. Report area of the clearing in hectares and perimeter in meters.
[edit] Using Google Maps for digitizing
Web map services (WMS) like Google Maps, Bing Maps, Yahoo Maps and OpenStreemap use a special projected coordinate reference system called "Pseudo Mercator" or "Web Mercator".
- Select Web --> OpenLayers plugin --> Google Maps --> Google Satellite. Of course, you can also add a hybrid layer or try the layers from other providers.
- If the Plugin doesn't exist you'll first have to install the Openlayers plugin using Plugins --> Manage and install plugins.
A new Layer Google Maps is loaded into the layers window. The project CRS is automatically set to WGS84/Pseudo Mercator (EPSG:3857). Check the actual project CRS Project --> Project Properties --> CRS, the checkbox 'on the fly' transformation is switched on. The EPSG code of the actual project CRS is also displayed on the lower right below the viewer.
- Select a raster or a vector layer from your region of interest in the layers window, right click Zoom to layer extent.
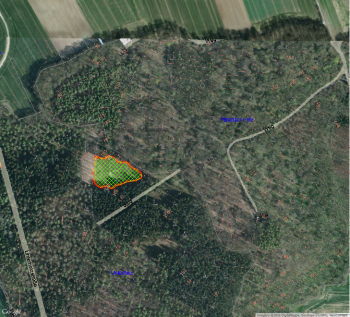
- Select the vector layer clearing and toggle the digitizing mode on (s.a.). Continue to digitize clearings but now using Google Maps as reference (Fig. C).
- Calculate area and perimeter of your polygon layer (s.a.) Important to note that the Layer CRS must defined as a metric CRS (eg. UTM) not as WGS84/Pseudo Mercator (EPSG:3857), otherwise you get wrong results for area and perimeter!


