Exercise: Displaying German Geobasis data (GBD)
From AWF-Wiki
(Difference between revisions)
(→Load a digital aerial ortho photo "DOP20") |
(→Load a digital aerial ortho photo "DOP20") |
||
| (19 intermediate revisions by 2 users not shown) | |||
| Line 1: | Line 1: | ||
==Load a German base map "Amtliche Karte"== | ==Load a German base map "Amtliche Karte"== | ||
| − | # Start QGIS 2. | + | # Download the tutorial data GBData.zip as a compressed archive file from Stud.IP. |
| − | # Click the {{button|text=Add raster layer}} button [[Image:QGIS_2.0_addrast.png|20px]] and select all files with the extension ''*.tif'' from the folder ''GBData | + | # Start QGIS 2.14 Right click into the layers window, {{button|text=Add group}} and type ''Amtliche Karte''. Highlight the new goup. |
| − | # Now you are asked to specify the Coordinate Reference System for the first tif file. This is the default behaviour of QGIS 2. | + | # Click the {{button|text=Add raster layer}} button [[Image:QGIS_2.0_addrast.png|20px]] and select all files with the extension ''*.tif'' from the folder ''.\GBData\AK5v''. Press and hold down CTRL, and then click each file with the extension ''*.tif''.{{button|text=OK}}. |
| + | # Now you are asked to specify the Coordinate Reference System for the first tif file. This is the default behaviour of QGIS 2.14 loading data sets without CRS description. The data were delivered by LGLN Lower Saxony that is fully covered by the UTM-Zone 32 with the horizontal geodetic datum ETRS89. Therefore the EPSG-Code is 25832. In this case the easting value is not prefixed by the UTM zone number and a false easting value of 500km is added. There are several other EPSG-Codes defined by the [http://www.adv-online.de AdV (Arbeitsgemeinschaft der Vermessungsverwaltungen in Germany)]. Please check the metadata of your data provider to select the right EPSG-code. Type into the text field "Filter": ''25832'' and than click on {{button|text=ETRS89 / UTM zone 32N}} to select the right CRS for the tiles of the "Amtliche Karte" {{button|text=OK}}. Confirm this CRS for all other selected tiles with {{button|text=OK}}. | ||
# Mark "Amtliche Karte" in the Layers window, right click {{button|text=Zoom to group}} to have an overview on all tiles. You may switch off the checkbox before a layer or a group to disable rendering. If we mark one single layer and right click {{button|text=Zoom to layer}} we see only the extent of one tile. Right click {{mitem|text=Properties --> Metadata}} to obtain informations on the data type (8 bit), dimensions (4000 x 4000 pixel), and pixel size on the ground (0.25x0.25m). | # Mark "Amtliche Karte" in the Layers window, right click {{button|text=Zoom to group}} to have an overview on all tiles. You may switch off the checkbox before a layer or a group to disable rendering. If we mark one single layer and right click {{button|text=Zoom to layer}} we see only the extent of one tile. Right click {{mitem|text=Properties --> Metadata}} to obtain informations on the data type (8 bit), dimensions (4000 x 4000 pixel), and pixel size on the ground (0.25x0.25m). | ||
==Load a digital aerial ortho photo "DOP20" == | ==Load a digital aerial ortho photo "DOP20" == | ||
| − | # Click the {{button|text=Add raster layer}} button [[Image:QGIS_2.0_addrast.png|20px]] and select the file ''dop20_colir_32560000_5716000_utm32_etrs89.tif'' in the folder ''GBData | + | # Click the {{button|text=Add raster layer}} button [[Image:QGIS_2.0_addrast.png|20px]] and select the file ''dop20_colir_32560000_5716000_utm32_etrs89.tif'' in the folder ''.\GBData\DOP''. In the Layers window drag and drop this layer on top of the group "Amtliche Karte". Mark and right click {{button|text=Zoom to layer}}. The display of the digital orthophoto (DOP) doesn't look appealing. Right click {{mitem|text=Properties --> Transparency}} and change the drop list "Transparency band" from {{button|text=Band 4 (Alpha)}} to {{button|text=None}}. {{button|text=Apply}}. A true color composite is rendered. |
# Create a false color composite. click {{mitem|text=Properties --> Style}}. Change the band assignment "Red band": {{button|text=Band 4}}, "Green band": {{button|text=Band 3}}, "Blue band": {{button|text=Band 2}} and the contrast enhancement to {{button|text=Stretch to MinMax}}. Click first {{button|text=Load}} and second {{button|text=Apply}} to display an enhanced standard false color composite. | # Create a false color composite. click {{mitem|text=Properties --> Style}}. Change the band assignment "Red band": {{button|text=Band 4}}, "Green band": {{button|text=Band 3}}, "Blue band": {{button|text=Band 2}} and the contrast enhancement to {{button|text=Stretch to MinMax}}. Click first {{button|text=Load}} and second {{button|text=Apply}} to display an enhanced standard false color composite. | ||
| − | # Improve the rendering speed. Make that you | + | # Improve the rendering speed. Make that you already use the new [Display settings] of QGIS 2.14 select the DOP layer in the layers window {{mitem|text=Properties --> Pyramids}}. Mark all resolution pyramids and click {{button|text=Build pyramids}}. The zoom performance is even more improved. |
| − | # Overlay the DOP with the Amtliche Karte. In the layers window drag and drop the layer ''dop20_colir_32560000_5716000_utm32_etrs89'' under the group ''Amtliche Karte''. Find out which Amtliche Karte tiles cover the DOP! Change the transparency ot the Amtliche Karte. Zoom to the layer (''325615717_col''). With the "Identify Feature" tool the integer numbers of the AK5 classes are shown as result. Mark the AK5 layer in the Layers window, {{mitem|text=Properties --> Transparency}}. Activate {{button|text=Add values from Display}} and select parts of the AK5 which should be transparent. {{button|text=Apply}}. | + | # Overlay the DOP with the Amtliche Karte ('''Fig. A'''). In the layers window drag and drop the layer ''dop20_colir_32560000_5716000_utm32_etrs89'' under the group ''Amtliche Karte''. Find out which Amtliche Karte tiles cover the DOP! Change the transparency ot the Amtliche Karte. Zoom to the layer (''325615717_col''). With the "Identify Feature" tool the integer numbers of the AK5 classes are shown as result. Mark the AK5 layer in the Layers window, {{mitem|text=Properties --> Transparency}}. Activate {{button|text=Add values from Display}} and select parts of the AK5 which should be transparent. {{button|text=Apply}}. |
| + | [[Image:change_AK5v_transparency.png|center|250px]] | ||
# Copy the color table setting of one layer to all other AK5 layers: Mark the AK5 layer ''325615717_col'' in the Layers window, right click {{mitem|text=Copy Style}}. Mark another AK5 layer, right click {{mitem|text=Paste Style}}. | # Copy the color table setting of one layer to all other AK5 layers: Mark the AK5 layer ''325615717_col'' in the Layers window, right click {{mitem|text=Copy Style}}. Mark another AK5 layer, right click {{mitem|text=Paste Style}}. | ||
# Save the layer and color table settings in a project file to proceed later with your work. {{mitem|text=Project --> Save as ..}}. | # Save the layer and color table settings in a project file to proceed later with your work. {{mitem|text=Project --> Save as ..}}. | ||
| − | # To use the GEarthView plugin you need to install [http://www.google.de/intl/de/earth Google Earth] before. Then install the plugin GEarthView using {{mitem|text=Plugins | + | <!-- # To use the GEarthView plugin you need to install [http://www.google.de/intl/de/earth Google Earth] before. Then install the plugin GEarthView using {{mitem|text=Plugins -> Manage and install plugins}}. Click on the GEarthView symbol to overlay the current QGIS view on top of Google Earth ('''Fig. B''').--> |
| + | {| class="wikitable" | ||
| + | |[[Image:overlay_ortho_AK5.png|450px|thumb|right|'''Figure A''': Digital aerial orthophoto DOP20 overlaid on Amtliche Karte (AK5)]] | ||
| + | |[[Image:overlay_ortho_AK5_gearth.png|650px|thumb|right|'''Figure B''': Digital aerial orthophoto DOP20 and AK5 overlaid on Google Earth]] | ||
| + | |} | ||
| + | |||
| + | [[category:Forestry Application]] | ||
Latest revision as of 10:14, 6 July 2016
[edit] Load a German base map "Amtliche Karte"
- Download the tutorial data GBData.zip as a compressed archive file from Stud.IP.
- Start QGIS 2.14 Right click into the layers window, Add group and type Amtliche Karte. Highlight the new goup.
- Click the Add raster layer button
 and select all files with the extension *.tif from the folder .\GBData\AK5v. Press and hold down CTRL, and then click each file with the extension *.tif.OK.
- Now you are asked to specify the Coordinate Reference System for the first tif file. This is the default behaviour of QGIS 2.14 loading data sets without CRS description. The data were delivered by LGLN Lower Saxony that is fully covered by the UTM-Zone 32 with the horizontal geodetic datum ETRS89. Therefore the EPSG-Code is 25832. In this case the easting value is not prefixed by the UTM zone number and a false easting value of 500km is added. There are several other EPSG-Codes defined by the AdV (Arbeitsgemeinschaft der Vermessungsverwaltungen in Germany). Please check the metadata of your data provider to select the right EPSG-code. Type into the text field "Filter": 25832 and than click on ETRS89 / UTM zone 32N to select the right CRS for the tiles of the "Amtliche Karte" OK. Confirm this CRS for all other selected tiles with OK.
- Mark "Amtliche Karte" in the Layers window, right click Zoom to group to have an overview on all tiles. You may switch off the checkbox before a layer or a group to disable rendering. If we mark one single layer and right click Zoom to layer we see only the extent of one tile. Right click Properties --> Metadata to obtain informations on the data type (8 bit), dimensions (4000 x 4000 pixel), and pixel size on the ground (0.25x0.25m).
[edit] Load a digital aerial ortho photo "DOP20"
- Click the Add raster layer button
 and select the file dop20_colir_32560000_5716000_utm32_etrs89.tif in the folder .\GBData\DOP. In the Layers window drag and drop this layer on top of the group "Amtliche Karte". Mark and right click Zoom to layer. The display of the digital orthophoto (DOP) doesn't look appealing. Right click Properties --> Transparency and change the drop list "Transparency band" from Band 4 (Alpha) to None. Apply. A true color composite is rendered.
- Create a false color composite. click Properties --> Style. Change the band assignment "Red band": Band 4, "Green band": Band 3, "Blue band": Band 2 and the contrast enhancement to Stretch to MinMax. Click first Load and second Apply to display an enhanced standard false color composite.
- Improve the rendering speed. Make that you already use the new [Display settings] of QGIS 2.14 select the DOP layer in the layers window Properties --> Pyramids. Mark all resolution pyramids and click Build pyramids. The zoom performance is even more improved.
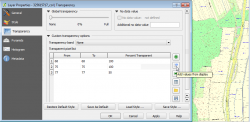
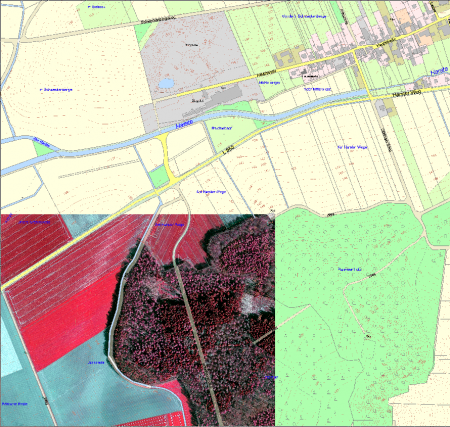
- Overlay the DOP with the Amtliche Karte (Fig. A). In the layers window drag and drop the layer dop20_colir_32560000_5716000_utm32_etrs89 under the group Amtliche Karte. Find out which Amtliche Karte tiles cover the DOP! Change the transparency ot the Amtliche Karte. Zoom to the layer (325615717_col). With the "Identify Feature" tool the integer numbers of the AK5 classes are shown as result. Mark the AK5 layer in the Layers window, Properties --> Transparency. Activate Add values from Display and select parts of the AK5 which should be transparent. Apply.
- Copy the color table setting of one layer to all other AK5 layers: Mark the AK5 layer 325615717_col in the Layers window, right click Copy Style. Mark another AK5 layer, right click Paste Style.
- Save the layer and color table settings in a project file to proceed later with your work. Project --> Save as ...


