Minimum crown cover
(Created page with "{{Content Tree|HEADER=Forest mensuration lecture notes|NAME=Forest mensuration}} __TOC__ ==Introduction== [[File:2.1.3.6-fig5.png|right|300px|thumb|'''Figure 1''' A set of refe...") |
|||
| (6 intermediate revisions by 3 users not shown) | |||
| Line 1: | Line 1: | ||
| − | {{ | + | {{Ficontent}} |
__TOC__ | __TOC__ | ||
| − | |||
| − | |||
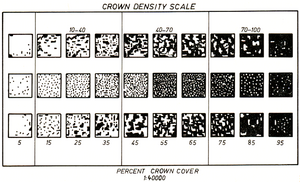
[[File:2.1.3.6-fig5.png|right|300px|thumb|'''Figure 1''' A set of reference pictures for percentage crown cover.]] | [[File:2.1.3.6-fig5.png|right|300px|thumb|'''Figure 1''' A set of reference pictures for percentage crown cover.]] | ||
| − | |||
Minimum crown cover is frequently one of the central criteria in [[Forest Definition|forest definitions]]. This criterion is seemingly easy to understand and measure, in particular from [[remote sensing imagery]]. And if not measured, reference tables can be used as the one given in Figure 1. Some issues regarding the minimum crown cover will be discussed in this section. | Minimum crown cover is frequently one of the central criteria in [[Forest Definition|forest definitions]]. This criterion is seemingly easy to understand and measure, in particular from [[remote sensing imagery]]. And if not measured, reference tables can be used as the one given in Figure 1. Some issues regarding the minimum crown cover will be discussed in this section. | ||
| Line 24: | Line 21: | ||
results, where minimum crown cover t goes from 0.1 to 0.9 and where the reference area takes on the values one single cell and then of combined blocks of 2x2 cells, 3x3 cells and 4x4 cells. | results, where minimum crown cover t goes from 0.1 to 0.9 and where the reference area takes on the values one single cell and then of combined blocks of 2x2 cells, 3x3 cells and 4x4 cells. | ||
| − | + | <blockquote> | |
| + | {| | ||
| + | |- | ||
| + | | '''Table 1.''' The relationship between minimum crown cover percent, reference cell size and forest cover estimates (Kleinn 2000<ref name="kleinn2000a" />) | ||
| + | |- | ||
| + | {| class="wikitable" | ||
| + | ! rowspan="2" | '''Cell size''' | ||
| + | ! colspan="9" | Minimum crown cover ''t'' | ||
| + | |- | ||
| + | ! 0.10 !!0.20 !! 0.30 !! 0.40 !! 0.50 !! 0.60 !! 0.70 !! 0.80 !! 0.90 | ||
| + | |- | ||
| + | | '''1 by 1''' || 0.7936 || 0.6826 || 0.6155 || 0.5700 || 0.5373 || 0.4829 || 0.4031 || 0.3077 || 0.1997 | ||
| + | |- | ||
| + | | '''2 by 2''' || 0.8977 || 0.7836 || 0.7193 || 0.6257 || 0.5234 || 0.4269 || 0.3363 || 0.2281 || 0.1228 | ||
| + | |- | ||
| + | | '''3 by 3''' || 0.9317 || 0.8571 || 0.7453 || 0.6646 || 0.5217 || 0.3727 || 0.2919 || 0.1863 || 0.0932 | ||
| + | |- | ||
| + | | '''4 by 4''' || 0.9355 || 0.8172 || 0.7527 || 0.6452 || 0.5054 || 0.3548 || 0.2043 || 0.1183 || 0.0215 | ||
| + | |- | ||
| + | |} | ||
| + | |} | ||
| + | </blockquote> | ||
| − | |||
| − | [[File:2.1.3.6-fig7.png| | + | [[File:2.1.3.6-fig7.png|300px]] |
'''Figure 3''' above gives an graphical illustration of the data presented in table 1 (Kleinn 2000<ref name="kleinn2000a">Kleinn C. 2000. Estimating metrics of forest spatial pattern from large area forest inventory cluster samples. Forest Science 46(4):548-557.</ref>) | '''Figure 3''' above gives an graphical illustration of the data presented in table 1 (Kleinn 2000<ref name="kleinn2000a">Kleinn C. 2000. Estimating metrics of forest spatial pattern from large area forest inventory cluster samples. Forest Science 46(4):548-557.</ref>) | ||
| + | |||
It can be seen that changing cell size, which is used as a reference for measuring crown cover, while maintaining minimum crown cover percentage yields different estimation of forest cover. While maintaining reference cell size, higher minimum crown cover percentage lead to smaller values for forest cover. The effect of reference area, however, is not so straightforward: making the reference area larger leads to larger forest area values for small <math>t</math> but to smaller forest area values for larger <math>t</math>. Here, for <math>t=0.5</math> is the effect of changing reference area smallest. Figure 3 gives a graphical illustration of the data presented in Table 1. | It can be seen that changing cell size, which is used as a reference for measuring crown cover, while maintaining minimum crown cover percentage yields different estimation of forest cover. While maintaining reference cell size, higher minimum crown cover percentage lead to smaller values for forest cover. The effect of reference area, however, is not so straightforward: making the reference area larger leads to larger forest area values for small <math>t</math> but to smaller forest area values for larger <math>t</math>. Here, for <math>t=0.5</math> is the effect of changing reference area smallest. Figure 3 gives a graphical illustration of the data presented in Table 1. | ||
| Line 44: | Line 62: | ||
}} | }} | ||
| − | [[Category:Definitions in forest inventory]] | + | [[Category:Definitions in forest inventory|2]] |
Latest revision as of 09:02, 28 October 2013
Contents |
Minimum crown cover is frequently one of the central criteria in forest definitions. This criterion is seemingly easy to understand and measure, in particular from remote sensing imagery. And if not measured, reference tables can be used as the one given in Figure 1. Some issues regarding the minimum crown cover will be discussed in this section.
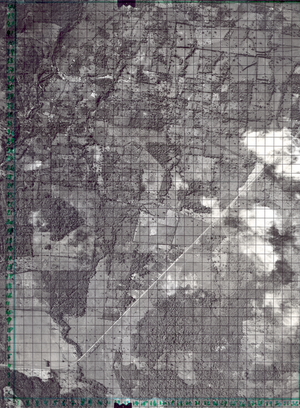
It is clear that crown cover can not be determined at a dimensionless point, but a certain area needs to be observed to be able to calculate the ratio between the area covered by tree crowns and the total area. We need to define a reference area on which crown cover is to be determined. In order to illustrate the effect of minimum crown cover and size of the reference area on forest area estimates, let’s have a look at the illustrating example in Figure 2.
[edit] Forest cover estimation

We wish to estimate forest area in the inventory region which is subdivided into small cells that are to be used as reference area each for the determination of crown cover percent. We take here for illustration a simplistic forest definition with only the minimum crown cover percent as criterion. That is, a cell is forest if its crown cover exceeds the defined minimum – regardless of land use, roads etc. When we do this decision for each and every cell, then we can come up with a forest area estimation by simply dividing the number of forest cells by the total number of cells (we simulate here actually systematic sampling); if, for example, 351 cells out of 1000 were found to be forest, then our forest cover estimate would be 0.351 or 35.1%.
We are now interested in two questions:
- How does the forest cover estimate change when we change the minimum crown cover?
- How does the forest cover estimate change when we change the size of the reference area on which the crown cover is being determined?
While the answer to question 1 is quite obvious (the higher the minimum crown cover, the less forest), this is not so obvious for question 2. Table 1 gives the results, where minimum crown cover t goes from 0.1 to 0.9 and where the reference area takes on the values one single cell and then of combined blocks of 2x2 cells, 3x3 cells and 4x4 cells.
Table 1. The relationship between minimum crown cover percent, reference cell size and forest cover estimates (Kleinn 2000[1])
Cell size Minimum crown cover t 0.10 0.20 0.30 0.40 0.50 0.60 0.70 0.80 0.90 1 by 1 0.7936 0.6826 0.6155 0.5700 0.5373 0.4829 0.4031 0.3077 0.1997 2 by 2 0.8977 0.7836 0.7193 0.6257 0.5234 0.4269 0.3363 0.2281 0.1228 3 by 3 0.9317 0.8571 0.7453 0.6646 0.5217 0.3727 0.2919 0.1863 0.0932 4 by 4 0.9355 0.8172 0.7527 0.6452 0.5054 0.3548 0.2043 0.1183 0.0215
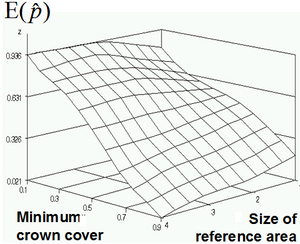
Figure 3 above gives an graphical illustration of the data presented in table 1 (Kleinn 2000[1])
It can be seen that changing cell size, which is used as a reference for measuring crown cover, while maintaining minimum crown cover percentage yields different estimation of forest cover. While maintaining reference cell size, higher minimum crown cover percentage lead to smaller values for forest cover. The effect of reference area, however, is not so straightforward: making the reference area larger leads to larger forest area values for small \(t\) but to smaller forest area values for larger \(t\). Here, for \(t=0.5\) is the effect of changing reference area smallest. Figure 3 gives a graphical illustration of the data presented in Table 1.
In conclusion, for the estimation of forest cover, when using the minimum crown cover criterion, it is not sufficient to only define the threshold value for that minimum crown cover, but we need also to define reference area on which the crown cover observation is to be taken. It is interesting to observe, however, that only in some few forest inventories this reference area is specified and defined although a threshold for minimum crown cover is given.
[edit] References
- ↑ 1.0 1.1 1.2 Kleinn C. 2000. Estimating metrics of forest spatial pattern from large area forest inventory cluster samples. Forest Science 46(4):548-557.

