Object-based supervised classification
From AWF-Wiki
(Difference between revisions)
(→Classification phase) |
|||
| Line 56: | Line 56: | ||
Load the output vector file manually into QGIS. {{mitem|text=Layer --> Layer properties --> Symbology > Style --> Load style...}}. Open the same QGIS style file which is already in use for the training data: {{typed|text=lucc_training_obia.qml}}. | Load the output vector file manually into QGIS. {{mitem|text=Layer --> Layer properties --> Symbology > Style --> Load style...}}. Open the same QGIS style file which is already in use for the training data: {{typed|text=lucc_training_obia.qml}}. | ||
| − | |||
| − | |||
| − | |||
| − | |||
| − | |||
| − | |||
| − | |||
| − | |||
| − | |||
| − | |||
| − | |||
| − | |||
| − | |||
| − | |||
| − | |||
| − | |||
| − | |||
| − | |||
| − | |||
| − | |||
| − | |||
| − | |||
| − | |||
| − | |||
| − | |||
| − | |||
| − | |||
| − | |||
| − | |||
| − | |||
| − | |||
| − | |||
| − | |||
| − | |||
| − | |||
| − | |||
| − | |||
| − | |||
| − | |||
| − | |||
| − | |||
| − | |||
| − | |||
| − | |||
| − | |||
| − | |||
| − | |||
| − | |||
| − | |||
| − | |||
| − | |||
[[Category:QGIS Tutorial]] | [[Category:QGIS Tutorial]] | ||
Revision as of 12:16, 17 December 2020
Contents |
Object-based image analysis (OBIA) with QGIS and OTB processing plugin
Segmentation
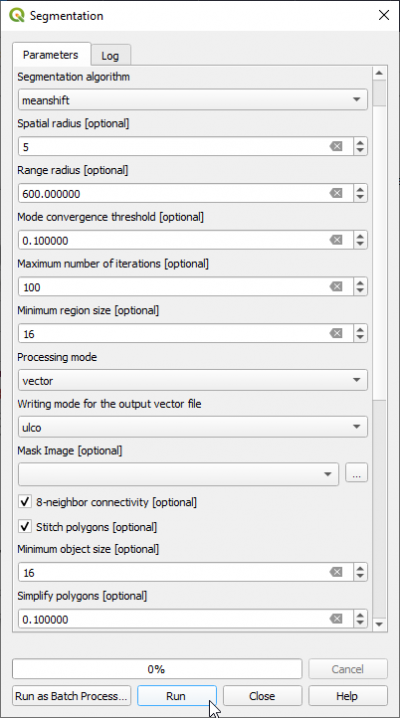
- In the search engine of Processing Toolbox, type segmentation and double click Segmentation.
- Set Segmentation algorithm to meanshift
- Select the input image: Subset_S2A_MSIL2A_20170619T_MUL.tif (data type uint 16bit).
- The Range radius value can be set to 600. The optimal value depends on datatype dynamic range of the input image and requires experimental trials for the specific classifcation objectives.
- Set Minimum Region size (in pixels) to 16.
- Processing mode Vector
- Set the Mask image to blank (top of dro-down list).
- The Minimum Segment size (in pixels) can be set to 16 depending on minimum mapping size.
- Check 8-neighborhood connectivity on.
- Change Output pixel type to uint32.
- Name the Output vector file e.g. segments_meanshift_seg.gpkg (GeoPackage).
- Click Run.
- Evaluate the segmentation results: Load the output vector file segments_meanshift.gpkg into QGIS on top of the image Subset_S2A_MSIL2A_20170619T_Mul.tif
Mark the vector layer in the Qgis Layers window. Layer --> Properties --> Symbology --> Simple Fill, Fill Style: No Brush and Stroke color:white.
Feature extraction
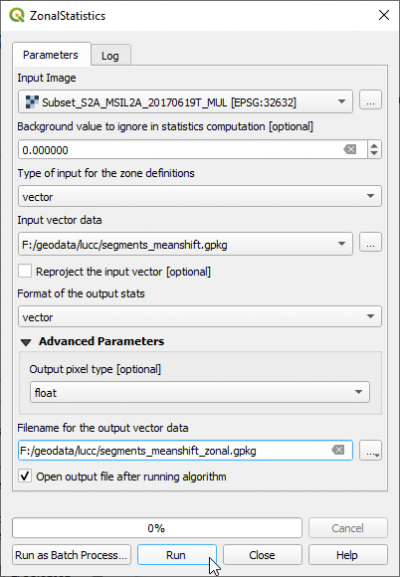
In the search engine of Processing Toolbox, type zonalstats and open ZonalStatistics under Image Manipulation of OTB.
- Select the Input image: Subset_S2A_MSIL2A_20170619T_MUL.tif.
- Background value to ignore: 0
- For the Input vector data do not select a vector file from the file list which are already loaded in the QGIS Viewer. There is currently a bug in QGIS 3.16 which leads to failure because the full pathname is not parsed correctly. Instead, please select a vector file by clicking
 and browse directly to the file containing the result from Segmentation: segment polygons in format GPKG segments_meanshift.gpkg.
- File name for the output vector data: segments_meanshift_zonal.gpkg.
- Click Run.
Training phase
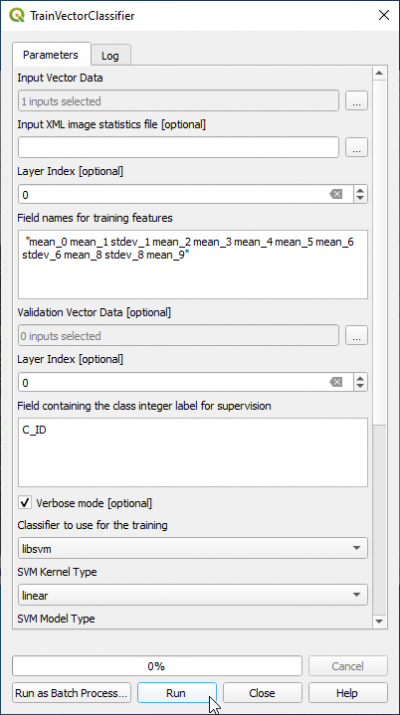
- In the search engine of Processing Toolbox, type Train and double click TrainVectorClassifier.
- In the Input Vector Data List do not select a file from the list which is already loaded in the QGIS Viewer. There is currently a bug in QGIS 3.16 which leads to failure during file import. Instead please select a vector file clicking
 and browse directly to the file containing training area polygons in format GPKG or SHP e.g. lucc_training_obia.gpkg.
- Output model filename is svm_obia.model
- In the field Field names for training features copy and paste
"mean_0 mean_1 stdev_1 mean_2 mean_3 mean_4 mean_5 mean_6 stdev_6 mean_8 stdev_8 mean_9"
- The name of Field containing the class id for supervision" is C_ID.
- Classifier to use for training: libsvm
- SVM Kernel Type: linear
- SVM Model Type: csvc
- Click Parameters optimizationON.
- Click Run.
 Info
Info
- For more detailed information on the SVM algorithm visit the LibSVM website
Classification phase
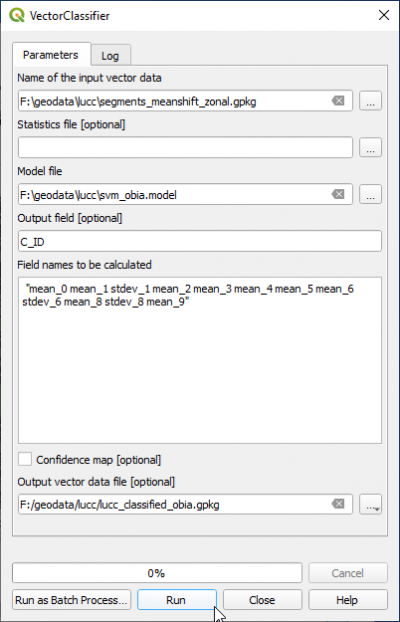
- In the search engine of Processing Toolbox, type Vector and double click VectorClassifier.
- In the Input Vector Data do not select a file from the list which is already loaded in the QGIS Viewer. There is currently a bug in QGIS 3.16 which leads to failure during file import. Instead please select a vector file clicking
 and browse directly to the file containing segments and features for the whole image (result of Feature extaction)training area polygons in format GPKG segments_meanshift_zonal.gpkg.
- Name of the input model file is svm_obia.model.
- Output field containing the class is C_ID
- Copy and paste into the field Field names to be calculated have to be the same features for prediction as were defined before in the TrainVectorClassifier module:
"mean_0 mean_1 stdev_1 mean_2 mean_3 mean_4 mean_5 mean_6 stdev_6 mean_8 stdev_8 mean_9"
- Output vector Data file is lucc_classified_obia.gpkg.
Run.
Load the output vector file manually into QGIS. Layer --> Layer properties --> Symbology > Style --> Load style.... Open the same QGIS style file which is already in use for the training data: lucc_training_obia.qml.


