Haralick Texture
From AWF-Wiki
(Difference between revisions)
| (One intermediate revision by one user not shown) | |||
| Line 7: | Line 7: | ||
* Select the size of the neighborhood in x and y direction. | * Select the size of the neighborhood in x and y direction. | ||
* Specify the range of the grey levels for the specific input band in the '''Image minimum''' and '''Image maximum''' field. Check [Raster metadata] for correct values! | * Specify the range of the grey levels for the specific input band in the '''Image minimum''' and '''Image maximum''' field. Check [Raster metadata] for correct values! | ||
| − | * Select as number of bins for the histogram: ''' | + | * Select as number of bins for the histogram: '''32'''. |
* Select the Texture Set: '''Simple''' | * Select the Texture Set: '''Simple''' | ||
| Line 24: | Line 24: | ||
# Cluster Prominence | # Cluster Prominence | ||
# Haralick Correlation | # Haralick Correlation | ||
| − | + | ||
{| class="wikitable" | {| class="wikitable" | ||
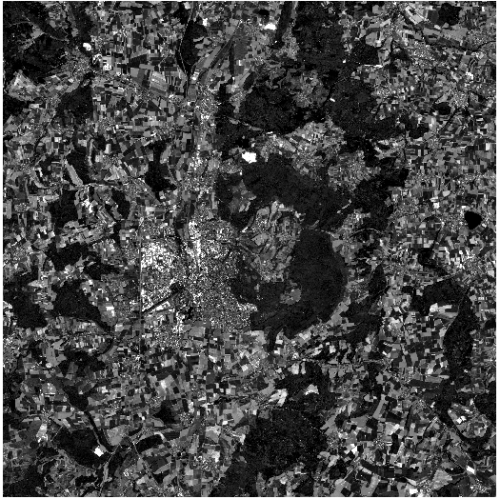
| − | |style="border: 0pt" | [[file:Qgis_goe_synthesis.png|thumb|left|500px|'''Figure A:''' Input image: Sentinel-2 | + | |style="border: 0pt" | [[file:Qgis_goe_synthesis.png|thumb|left|500px|'''Figure A:''' Input image: Sentinel-2 band B2, (University Göttingen Campus North)]] |
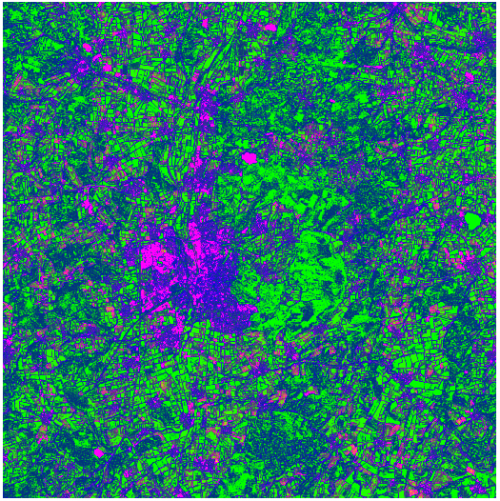
| − | |style="border: 0pt" | [[file:Qgis_goe_synthesis_haralick.png|thumb|center|500px|'''Figure B:''' Output image: Haralick textures (RGB= Haralick Correlation | + | |style="border: 0pt" | [[file:Qgis_goe_synthesis_haralick.png|thumb|center|500px|'''Figure B:''' Output image: Haralick textures (RGB= Haralick Correlation, Energy, Entropy)]] |
|} | |} | ||
[[category:Spatial Filtering]] | [[category:Spatial Filtering]] | ||
Latest revision as of 22:20, 29 November 2020
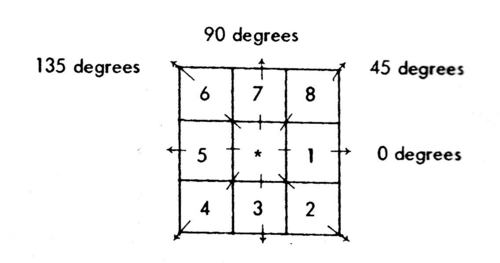
Image texture is a quantification of the spatial variation of grey tone values. Haralick et al. (1973) suggested the use of grey level co-occurrence matrices (GLCM). This method is based on the joint probability distributions of pairs of pixels. GLCM show how often each gray level occurs at a pixel located at a fixed geometric position relative to each other pixel, as a function of the gray level (Srinivasan and Shobha 2008). An essential component is the definition of eight nearest-neighbor resolution cells (Fig.) that define different matrices for different angles (0°,45°,90°,135°) and distances between the horizontal neighboring pixels.

3x3 window definition and spatial relationship for calculating Haralick texture measures. Pixel 1 and 5 are 0° (horizontal) nearest neighbors to the center pixel * ; pixel 2 and 6 are 135° nearest neighbors; pixels 3 and 7 are 90° nearest neighbors, pixel 4 and 8 are 45° nearest neighbors to the center pixel * (Haralick et al. 1973)
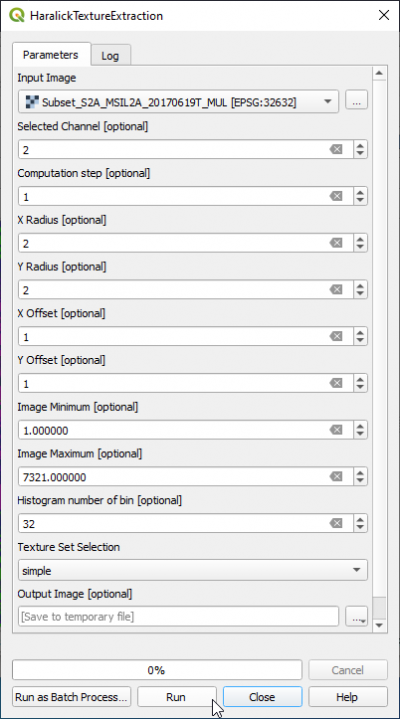
- In the search engine of the Processing Toolbox, type texture and select HaralickTextureExtraction under Feature Extraction of OTB.
- Under the Parameters tab, select a single band or a multiband file as input layer.
- Select a band number in case of a multiband file under Selected Channel
- Select the size of the neighborhood in x and y direction.
- Specify the range of the grey levels for the specific input band in the Image minimum and Image maximum field. Check [Raster metadata] for correct values!
- Select as number of bins for the histogram: 32.
- Select the Texture Set: Simple
- The result file contains the following texture measures:
- Energy
- Entropy
- Correlation
- Inverse Difference Moment
- Inertia
- Cluster Shade
- Cluster Prominence
- Haralick Correlation


