Map validation
From AWF-Wiki
(Difference between revisions)
(→Create validation sample points with a stratified sampling design) |
(→QGIS Processing toolbox with OTB plugin) |
||
| (9 intermediate revisions by one user not shown) | |||
| Line 4: | Line 4: | ||
# Select the output file name with the extension '''.csv''' under {{button|text=Matrix output}}. | # Select the output file name with the extension '''.csv''' under {{button|text=Matrix output}}. | ||
# The validation data can be in vector or raster format. Select as Ground truth {{button|text=vector}}. | # The validation data can be in vector or raster format. Select as Ground truth {{button|text=vector}}. | ||
| − | # Set the validation file ''' | + | # Set the validation file '''clip_regular_points.shp''' as {{button|text=Input reference vector data}}. |
| − | # Set the Field name with the class code ''' | + | # Set the Field name with the class code '''Code'''. |
# Click {{button|text=Run}}. | # Click {{button|text=Run}}. | ||
| − | # Open the CSV output file with Libre Office Calc or MS Excel. Calculate User accuracies, Producer accuracies, Overall accuracy and | + | # Open the CSV output file with Libre Office Calc or MS Excel. Calculate User accuracies, Producer accuracies, Overall accuracy and F-Scores. |
[[File:qgis_otb_confusionMatrix.png|400px]] | [[File:qgis_otb_confusionMatrix.png|400px]] | ||
| − | = Accuracy assessment and | + | |
| + | = Accuracy assessment and area estimation with R = | ||
FAO implemented a map validation and stratified area estimation tool based on R, Rstudio and the Shiny package. | FAO implemented a map validation and stratified area estimation tool based on R, Rstudio and the Shiny package. | ||
| − | The method is based on Olofsson et al. [ | + | The method is based on Olofsson et al. [http://dx.doi.org/10.1016/j.rse.2012.10.031 2013], [http://dx.doi.org/10.1016/j.rse.2014.02.015 2014]) |
If not already installed on your laptop: [http://wiki.awf.forst.uni-goettingen.de/wiki/index.php/R_installation install R], [http://www.rstudio.org RStudio] and [https://cran.r-project.org/bin/windows/Rtools/ Rtools]. | If not already installed on your laptop: [http://wiki.awf.forst.uni-goettingen.de/wiki/index.php/R_installation install R], [http://www.rstudio.org RStudio] and [https://cran.r-project.org/bin/windows/Rtools/ Rtools]. | ||
Start Rstudio and type into the console: | Start Rstudio and type into the console: | ||
| − | install.packages("shiny") | + | <pre> |
| − | + | install.packages("shiny", dependencies = TRUE) | |
| + | </pre> | ||
==Create validation sample points with a stratified random sampling design== | ==Create validation sample points with a stratified random sampling design== | ||
| + | Start Rstudio and type: | ||
<pre> | <pre> | ||
library(shiny) | library(shiny) | ||
| Line 23: | Line 26: | ||
</pre> | </pre> | ||
| + | ==Area estimation== | ||
| + | Start Rstudio and type: | ||
| + | <pre> | ||
| + | library(shiny) | ||
| + | options(shiny.launch.browser = TRUE) | ||
| + | runGitHub("openforis/accuracy-assessment",subdir="aa_analysis") | ||
| + | </pre> | ||
[[Category:QGIS Tutorial]] | [[Category:QGIS Tutorial]] | ||
Latest revision as of 19:02, 28 June 2020
Contents |
[edit] QGIS Processing toolbox with OTB plugin
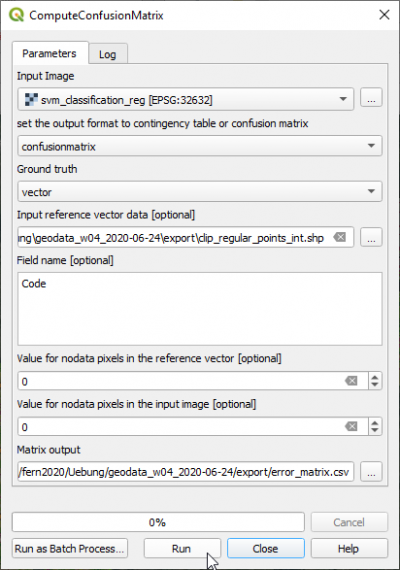
- Type into the search box of Processing tools Confusion and double click ComputeConfusionMatrix.
- Set the classified map as Input image.
- Select the output file name with the extension .csv under Matrix output.
- The validation data can be in vector or raster format. Select as Ground truth vector.
- Set the validation file clip_regular_points.shp as Input reference vector data.
- Set the Field name with the class code Code.
- Click Run.
- Open the CSV output file with Libre Office Calc or MS Excel. Calculate User accuracies, Producer accuracies, Overall accuracy and F-Scores.
[edit] Accuracy assessment and area estimation with R
FAO implemented a map validation and stratified area estimation tool based on R, Rstudio and the Shiny package. The method is based on Olofsson et al. 2013, 2014) If not already installed on your laptop: install R, RStudio and Rtools. Start Rstudio and type into the console:
install.packages("shiny", dependencies = TRUE)
[edit] Create validation sample points with a stratified random sampling design
Start Rstudio and type:
library(shiny)
options(shiny.launch.browser = TRUE)
runGitHub("openforis/accuracy-assessment",subdir="aa_design")
[edit] Area estimation
Start Rstudio and type:
library(shiny)
options(shiny.launch.browser = TRUE)
runGitHub("openforis/accuracy-assessment",subdir="aa_analysis")
