Cloud masking
From AWF-Wiki
(Difference between revisions)
(→Sentinel-2 cloud masking) |
|||
| Line 7: | Line 7: | ||
# The original single band cloud quality indicator band is included in this specifc multiband file as band No. 13. Follow [[Split stack]] to extract this band. | # The original single band cloud quality indicator band is included in this specifc multiband file as band No. 13. Follow [[Split stack]] to extract this band. | ||
# Overlay the QI Cloud band on top of the color composites. Use the Identify Feature Tool for requesting pixel values of the QI band file inside a cloud. Which values represent clouds? | # Overlay the QI Cloud band on top of the color composites. Use the Identify Feature Tool for requesting pixel values of the QI band file inside a cloud. Which values represent clouds? | ||
| − | # | + | # In (Layer Properties Style load '''Load''' the full data range (minimum/maximum values) ). Then change the Style to a Pseudocolor map with interpolation '''discrete''' and 10 equal interval classes as shown in the screenshot. |
# Double click on a color field of a class (Layer Properties Style) to open change color window. Change the opacity from 100% to 0%. | # Double click on a color field of a class (Layer Properties Style) to open change color window. Change the opacity from 100% to 0%. | ||
[[File:Qgis_cloud_qi_pseudo.png|400px]] [[File:Qgis_cloud_qi_opacity.png|400px]] | [[File:Qgis_cloud_qi_pseudo.png|400px]] [[File:Qgis_cloud_qi_opacity.png|400px]] | ||
Revision as of 10:22, 12 November 2017
Sentinel-2 cloud masking
The exclusion of clouds and cloud shadow is an important processing step which is usually done in an early preprocessing stage. The Sentinel-2 products are annotated with Quality Indicators (QI_DATA). In the Level 2A product you may find a file in the folder QI_DATA with the extension _CLD_20m.jp2 (data type: 8bit unsigned integer, spatial resolution 20m) which might be used for masking clouds. The data range is from 0 for high confidence clear sky to 100 for high confidence cloudy (for more details see L2A Product Definition Document).
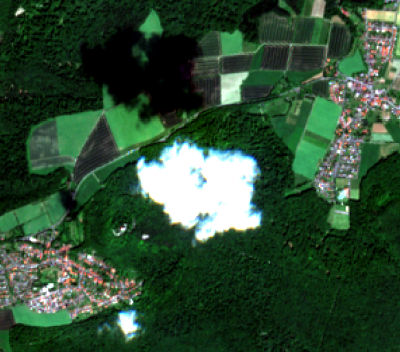
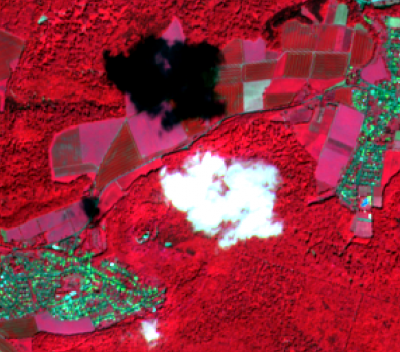
- Load a multiband Sentinel-2 satellite image (Level 2-A product) Changing Raster Layer Style to display a true color and a false color composite.
- Zoom in to a cloudy part of the image and compare the extent of cloud and cloud shadow in both composites. Which composite is better for displaying clouds?
- The original single band cloud quality indicator band is included in this specifc multiband file as band No. 13. Follow Split stack to extract this band.
- Overlay the QI Cloud band on top of the color composites. Use the Identify Feature Tool for requesting pixel values of the QI band file inside a cloud. Which values represent clouds?
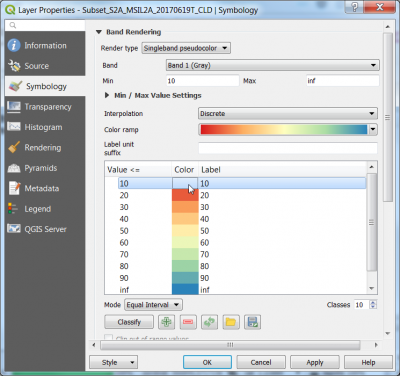
- In (Layer Properties Style load Load the full data range (minimum/maximum values) ). Then change the Style to a Pseudocolor map with interpolation discrete and 10 equal interval classes as shown in the screenshot.
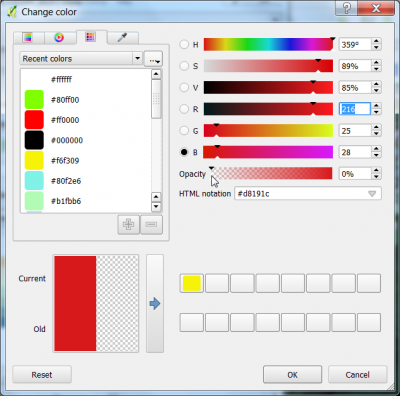
- Double click on a color field of a class (Layer Properties Style) to open change color window. Change the opacity from 100% to 0%.


