Spectral indices
From AWF-Wiki
(Difference between revisions)
(→Vegetation index using the Raster Calculator) |
(→Spectral indices using OTB) |
||
| Line 13: | Line 13: | ||
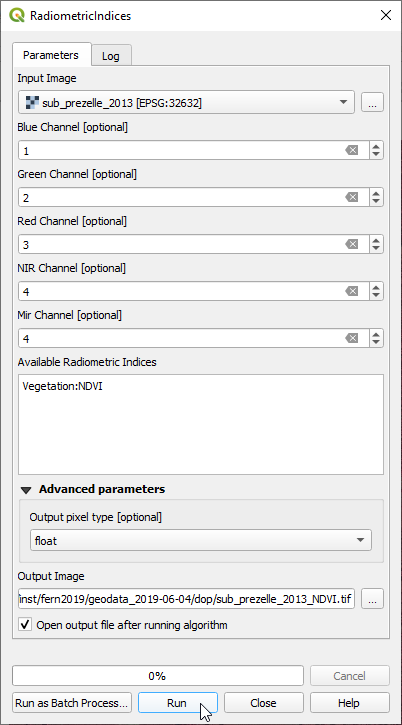
== Spectral indices using OTB == | == Spectral indices using OTB == | ||
| − | + | [[File:Qgis_radio_index.png|800px]] | |
[[Category:Working with Raster Data]] | [[Category:Working with Raster Data]] | ||
Revision as of 16:12, 8 November 2017
Vegetation index using the Raster Calculator
- Click the Add raster layer
 and select a multiband Sentinel-2 satellite image
- Check the rank and spectral range of bands in the multiband file (e.g. see table Changing Raster Layer Style).
- After clicking Open, the raster layer appears in the QGIS canvas.
- Click Raster --> Raster calculator.
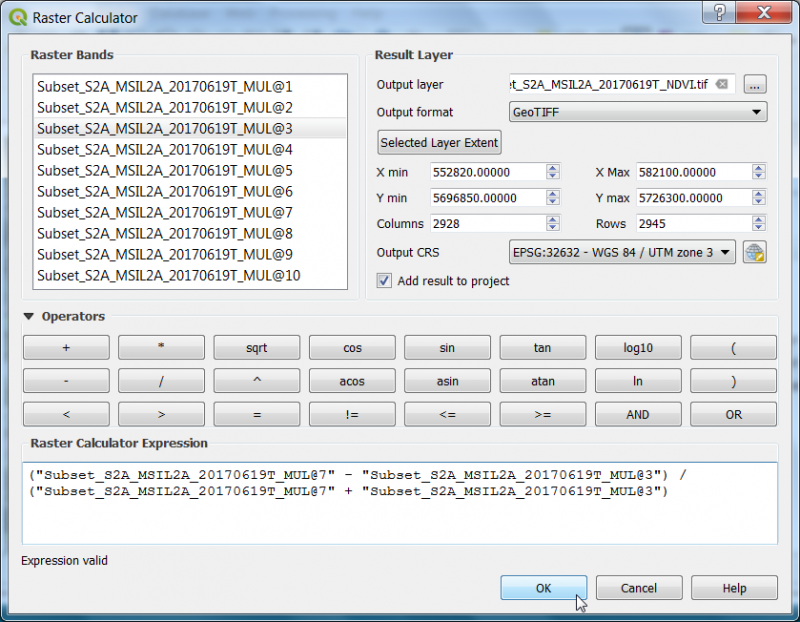
- A powerful normalization is realized by the normalized difference vegetation index that forms the basis of most vegetation indices $NDVI = (Nir - Red) / (Nir + Red)$. It can be implemented using Raster Calculator as seen in the following screenshot:
- Define path and file name of the output layer. OK.
- Map visualization: Open the raster layer properties by right-clicking the ndvi raster in the TOC selecting Properties, or by simply double clicking.
- Select the Style tab. Under Render type select Singleband pseudocolor.
- In the Generate new color map section select RdYlGn. In the Mode pulldown menu select Equal interval. Set the number of Classes to 10 and click Classify.
- To finish, click Apply.

