File:4.8-fig70.png
From AWF-Wiki

Size of this preview: 800 × 322 pixels.
Full resolution (816 × 328 pixels, file size: 786 KB, MIME type: image/png)
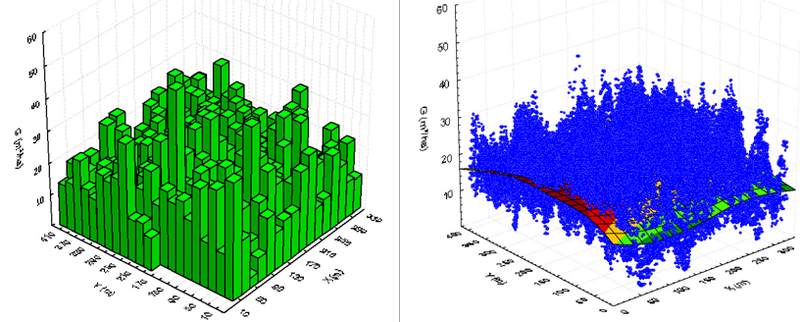
Illustration of approaches for plot populations for the same example population. Left: discrete population of square sample plots with defined positions. Right: each point in the area is a sampling element the value of which is determined by the surrounding trees (sample plot). Each point has a value which is here indicated through the cloud of points; in addition a trend surface is given.
Reference:
Kleinn C. und F. Vilčko. 2005. Ein Vergleich von zwei methodischen Konzepten für die Grundgesamtheit von Probeflächen bei Waldinventuren. AFJZ 176(4):68-74.
File history
Click on a date/time to view the file as it appeared at that time.
| Date/Time | Thumbnail | Dimensions | User | Comment | |
|---|---|---|---|---|---|
| current | 22:45, 9 March 2011 | 816 × 328 (786 KB) | Aspange (Talk | contribs) | Illustration of approaches for plot populations for the same example population. Left: discrete population of square sample plots with defined positions. Right: each point in the area is a sampling element the value of which is determined by the surroundi |
- Edit this file using an external application (See the setup instructions for more information)
File usage
The following page links to this file: