SAR flood mapping with SNAP
(→Visualization of amplitude bands) |
(→Visualization of amplitude bands) |
||
| Line 12: | Line 12: | ||
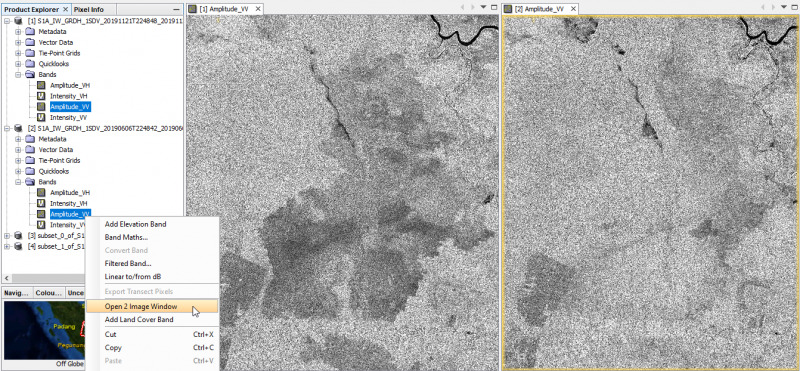
* Mark the Aplitude_VV bands of both products, right click '''Open 2 Image Window'''. | * Mark the Aplitude_VV bands of both products, right click '''Open 2 Image Window'''. | ||
| − | [[File:snap_sidebyside.png| | + | [[File:snap_sidebyside.png|800px]] |
=Subsetting= | =Subsetting= | ||
Revision as of 16:04, 3 December 2019
In this tutorial we will use Level-1 Ground Range Detected (GRD) Sentinel-1 data downloaded from the Copernicus Open Access Hub. The example data is from a study area in Nigeria near the city of Lokoja in Kogi province near the junction of the two large rivers Niger and Benue. During the westafrican monsoon April - September heavy rainfall and floods occur.
Contents |
Data transfer
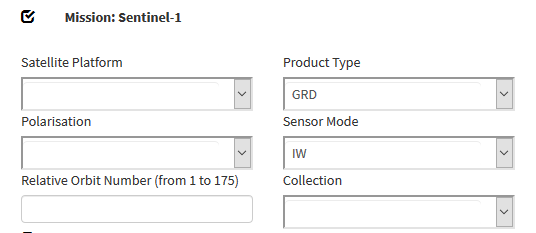
Download example tutorial data from Nigeria or data from your personal region of interest: two Sentinel-1 scenes one pre-event acquisition date and one post-event date: Downloading Sentinel-2 images. Select Product type GRD with VV polarization.
Visualization of amplitude bands
- Open SNAP Desktop.
- Drag and drop the zip files of the Sentinel-2 scenes into the TOC of Product Explorer.
- Unfold the product folders
- Mark the Aplitude_VV bands of both products, right click Open 2 Image Window.
Subsetting
Open SNAP Desktop. Drag and drop the zip files of the Sentinel-2 scenes into the TOC. We need to reduce the amount data by subsetting the large Sentinel-1 scenes.

